Join Our Telegram channel to stay up to date on breaking news coverage
Bitcoin (BTC) Price Prediction – February 5
Today, the Bitcoin (BTC) bulls moved against the USD at numerous levels which almost touched $9,800.
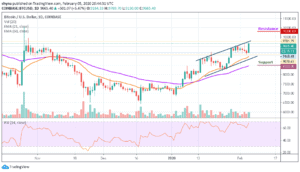
BTC/USD Long-term Trend: Bullish (Daily Chart)
Key levels:
Resistance Levels: $10,300, $10,500, $10,700
Support Levels: $8,500, $8,300, $8,100

The Bitcoin price has resumed its upward movement after a brief dip from January 31 to February 4 bringing the price from $9,497 to $9,168. A couple of days ago, BTC/USD hit just over $9,500 before retreating to a local low of around $9,078 yesterday. However, the decline was short-lived. Today, the price of the leading crypto asset is once again heading towards the north, in fact, it has returned to above the price levels seen during October 2019 trading.
In addition, the price of Bitcoin is now moving above the crucial levels which will now function as the support zones in the event a reversal occurs. Meanwhile, on the upside, as the coin moves and breaks out of the ascending channel, little is in place to prevent correction targeting the key resistance of $9,800 as the technical indicator RSI (14) moves above the 65-level. However, BTC/USD is strongly supported at the various former resistance levels include $9,300, $9,500 and $9,600.
Nevertheless, the coin is also banking on the support at $9,200, $9,000 and $8,800 to ensure that in spite of a reversal, the Bitcoin price stays above $9,500 level. Similarly, the nearest resistance levels to watch for are $10,300, $10,500 and $10,700 while the support levels to keep an eye on are $8,500, $8,300 and $8,100 respectively.
BTC/USD Medium – Term Trend: Bullish (4H Chart)
The 4-hour chart shows that the price will soon find its way upward as the RSI (14) is about entering into the overbought condition. Although, the bears have dominated the market for some time now; it is high time for the bulls to defend the $9,200 support and push the price towards the north.
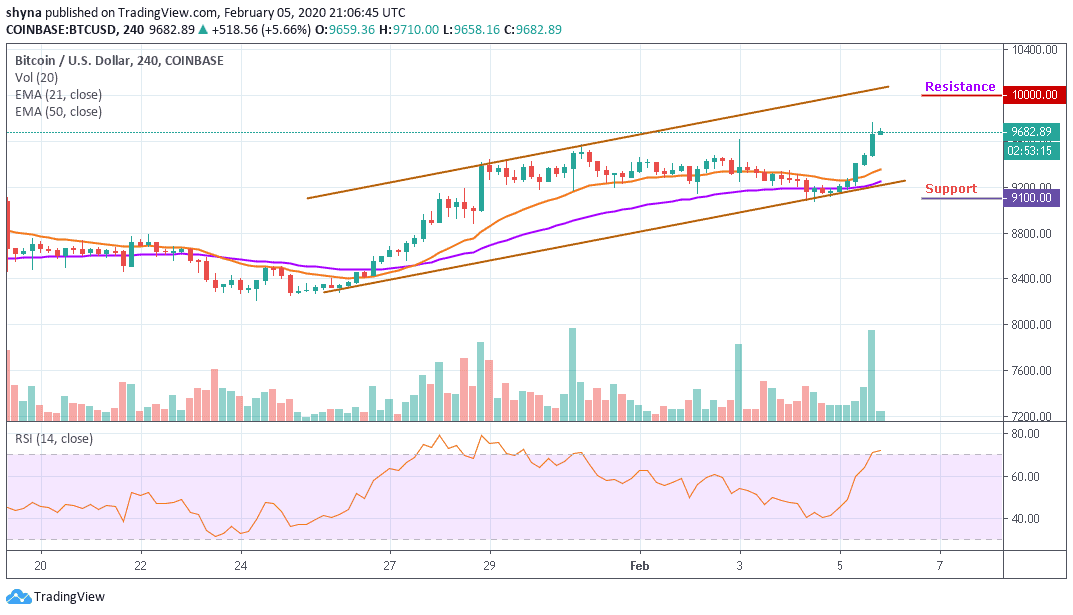
Meanwhile, the support levels of $9,100 and below may come into play if the price breaks below the 21 and 50 periods EMA within the ascending channel. But in as much as the buyers gathered enough momentum to power the market; they can make use of this opportunity to push the price towards the upper boundary of the channel where it could hit the targeted resistance levels of $10,000 and above.
Please note: Insidebitcoins.com is not a financial advisor. Do your research before investing your funds in any financial asset or presented product or event. We are not responsible for your investing results.
Join Our Telegram channel to stay up to date on breaking news coverage