Join Our Telegram channel to stay up to date on breaking news coverage
Bitcoin (BTC) Price Prediction – July 6
The price of Bitcoin is back above $9,200 as the recovery is coming up slowly.
BTC/USD Long-term Trend: Bearish (Daily Chart)
Key levels:
Resistance Levels: $9,600, $9,800, $10,000
Support Levels: $8,500, $8,300, $8,100
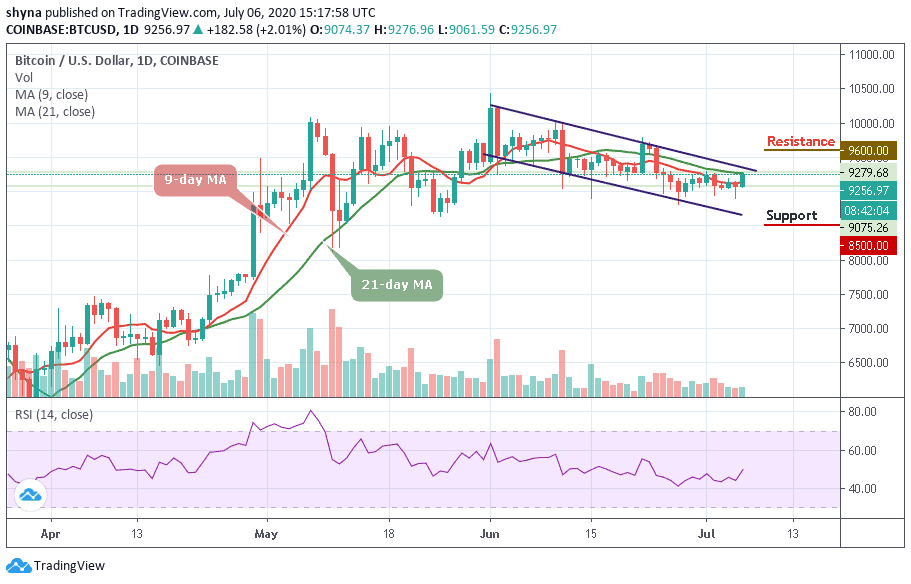
BTC/USD price movement on the daily chart is reflecting an improvement. If the same remains locked, then the expectation of quick recovery could turn out to be true. At the moment, BTC/USD is seen trading at $9,256 after soaring to $9,279 in the early hour of today’s trading. The coin is also seen pulling back to where it is trading currently and may likely head downwards if the bears step back into the market.
On the bearish side, it is important for Bitcoin to hold the 9-day moving average within the channel and confirm it otherwise there can come a bearish breakdown when BTCUSD fells below that barrier. The technical indicator RSI (14) is sending moderate signs where an oscillation to the higher boundary may confirm the proper trend which is more likely a bullish trend at the time of the outcome.
However, BTC/USD will confirm the bullish trend if the market price moves above the 9-day and 21-day moving averages while it will continue the bearish trend if the price moves below the moving averages. Meanwhile, a strong bullish spike above the channel may likely take the price to the resistance levels of $9,600, $9,800, and $10,000.
Nevertheless, if the market decides to follow the downward trend, the Bitcoin price may likely drop to the nearest support at $8,885, and should this support fails to contain sell-off, the market may experience another drop to the critical supports of $8,500, $8,300, and $8,100.
BTC/USD Medium-Term Trend: Ranging (4H Chart)
According to the 4-hour chart, BTC/USD is trading within the range of $9,067 to $9,321. However, the intraday trading is still looking bullish; at the beginning of today’s trading at $9,067 which is now a key support level. Meanwhile, the next key support levels are located at $9,100, $8,900, and $8,700.
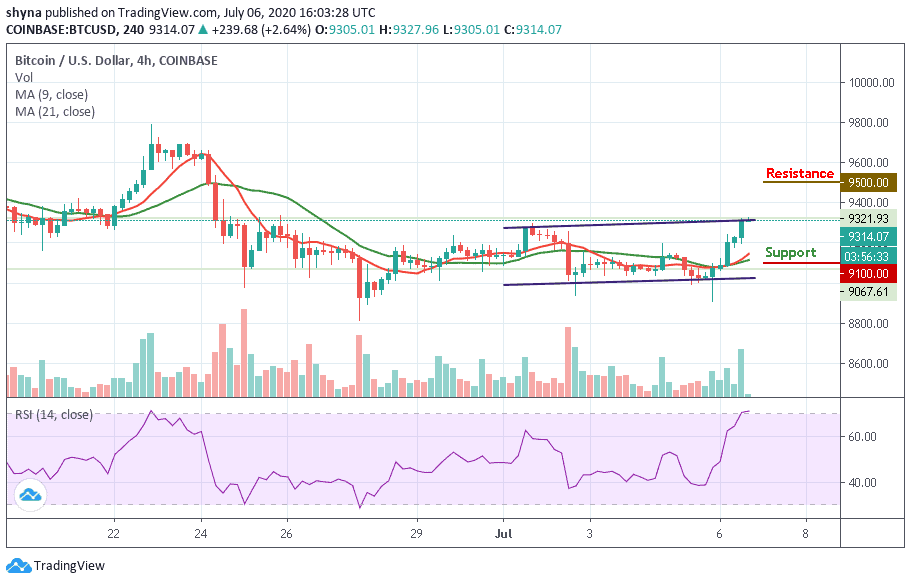
However, in as much as the buyers continue to reinforce and power the market more, traders can expect a retest at $9,400 resistance level, and breaking this level may further push the price towards the resistance level of $9,500 and above. Similarly, the RSI (14) moves into the overbought zone to confirm the bullish movement.
Join Our Telegram channel to stay up to date on breaking news coverage