


Join Our Telegram channel to stay up to date on breaking news coverage
Bitcoin (BTC) Price Prediction – March 14
c
BTC/USD Long-term Trend: Bearish (Daily Chart)
Key levels:
Resistance Levels: $6,800, $7,000, $7,200
Support Levels: $2,800, $2,600, $2,400
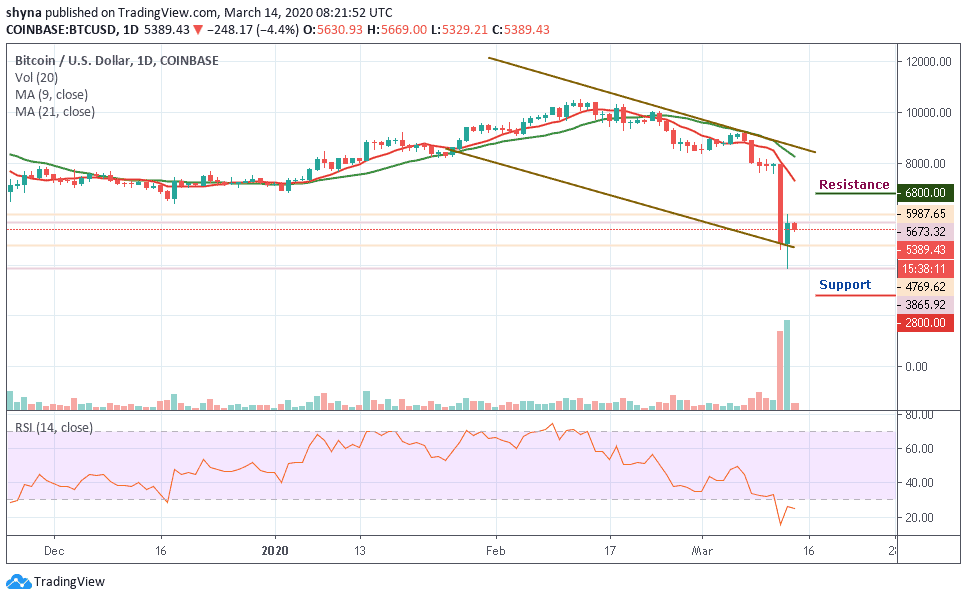
Looking at the daily chart, Bitcoin bears are actively taking back control as they are seen forcing BTC/USD to bow down to fresh losses. The digital asset with a market capitalization of $99.39 billion has corrected 4.4% lower on the day. At the time of writing, BTC/USD is changing hands at $5,389 after adjusting lower from $5,673 which is an intraday high. However, the bearish comeback may also break below a short term trend line support. In addition, BTC/USD remains vulnerable to losses as long as it continues to stay under the 9-day and 21-day moving averages on the daily chart.
Looking at the coin from a technical angle, one can say that stability is likely to take over amid signs of consolidation. For example, the RSI (14) may confirm the sideways movement as it is seen moving within the oversold area. In spite of the possible sideways action in the current session, BTC/USD is still under great risk of dropping to levels close to $5,000. Yesterday, the coin moved below $4,000 before finding support at $3,865. The inability to sustain steady uptrend hints a possible breakdown towards $3,000.
Nonetheless, the bulls are banking on the support at $5,200 and $5,000 to ensure that in spite of a reversal, the Bitcoin price stays above $5,000 level. Any further movement below $5,000 may push the coin towards the critical supports of $2,800, $2,600 and $2,400. Meanwhile, following the upward movement may allow the price to hit the nearest resistance levels at $6,800, $7,000 and $7,200 respectively.
BTC/USD Medium – Term Trend: Bearish (4H Chart)
BTC/USD is seen moving around the 9-day moving average as the 4-hour chart reveals, the bears are still in control while the bulls are trying to defend the $5,000 support. If not, the $4,300, $4,100 and $3,900 support levels may come into play if the coin focuses on the downward movement.
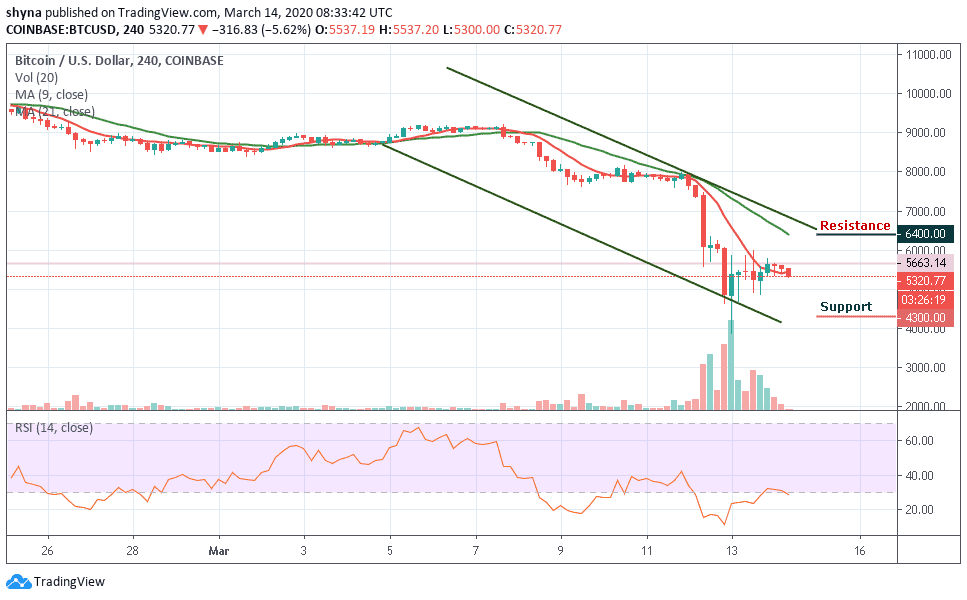
Moreover, the bulls may need to regroup and hold the support of $5,000, once this is done, traders may expect a retest at $6,000 resistance level and breaking this level may further take BTC/USD to $6,400, $6,600 and $6,800 resistance levels. The RSI (14) is moving back into the oversold zone, suggesting a continuous bearish movement.
Please note: Insidebitcoins.com is not a financial advisor. Do your research before investing your funds in any financial asset or presented product or event. We are not responsible for your investing results.
Join Our Telegram channel to stay up to date on breaking news coverage
