Join Our Telegram channel to stay up to date on breaking news coverage
Bitcoin (BTC) Price Prediction – April 15
The price of Bitcoin is trading in a tight range between $6,550 and $6,993 for the past few days.
BTC/USD Long-term Trend: Bullish (Daily Chart)
Key levels:
Resistance Levels: $7,900, $8,100, $8,300
Support Levels: $5,600, $5,400, $5,200
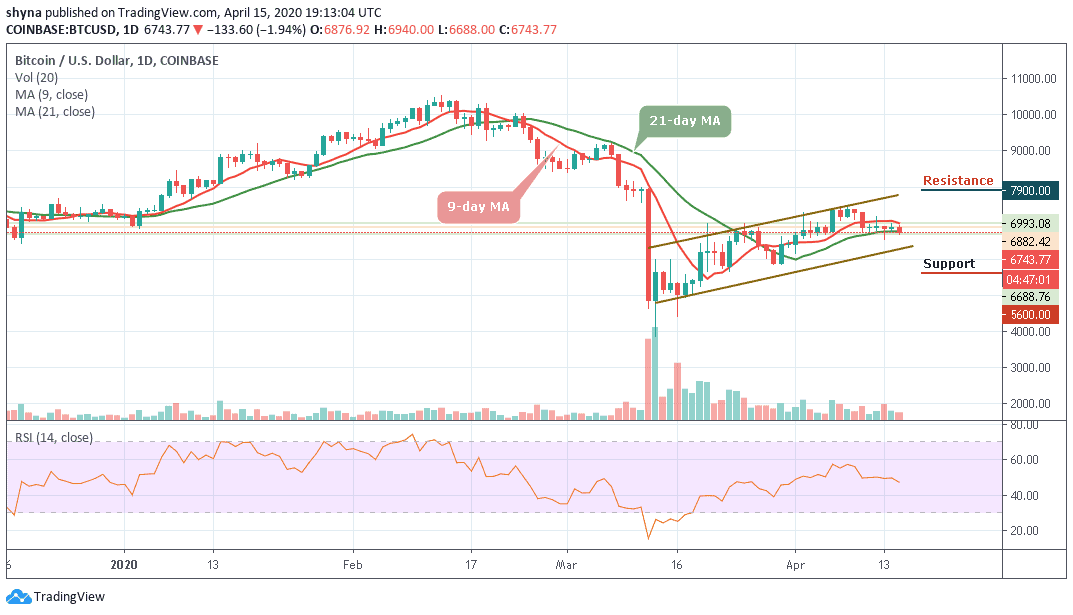
The movement in the Bitcoin price has reflected improvement. If the same remains locked, then the expectation of recovery could turn out to be true. BTC/USD was seen trading at $6,688 after soaring to $6,993. The coin then pulled back to where it is trading currently at $6,743 and may continue to head downwards if the bears step back into the market.
In addition, the market is deciding in-between the 9-day and 21-day moving averages, where the sellers are anticipating for a clear breakdown. Meanwhile, the $6,600 and $6,400 levels may further surface as critical supports should the bulls failed to hold the current price. However, a strong bearish spike might bring the price to $5,600, $5,400 and $5,200 support levels.
Moreover, if the market decides to follow the upward movement, Bitcoin’s price may cross above the 9-day MA and rise to $7,300. More so, any further bullish movement may send the price to the resistance level of $7,900, $8,100 and potentially $8,300. In other words, the RSI (14) for Bitcoin price suggests a downward movement; the market may fall to immediate supports.
BTC/USD Medium-term Trend: Bearish (4H Chart)
Bitcoin (BTC) has demolished all expectations of a price recovery anytime soon by falling below $7,000. After touching the low of $6,689, the price is currently trading around $6,745 level. Meanwhile, with the latest downward price swings, the coin could not show any significant signs of growth over the last 24 hours. On the upside, the next level of resistance to watch for lies at $7,000 and above.
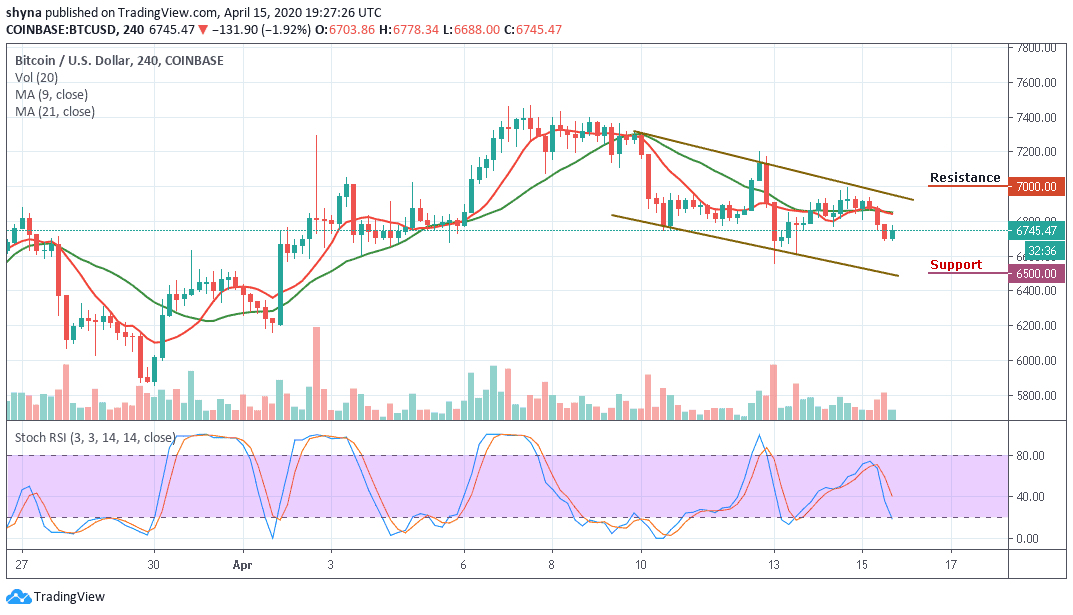
However, BTC couldn’t fight the resistance as it continued the downward movement. Overwhelming selling pressure pushed Bitcoin off-balance as it plunged under $6,700. The price thrust through the $6,695 support area. A significant drop below this support may cause new drops at $6,500 and $6,300 respectively. The stochastic RSI for BTC/USD on the 4-hour chart is facing the south.
Please note: Insidebitcoins.com is not a financial advisor. Do your research before investing your funds in any financial asset or presented product or event. We are not responsible for your investing results.
Join Our Telegram channel to stay up to date on breaking news coverage