Join Our Telegram channel to stay up to date on breaking news coverage
ETH Price Prediction – April 14
The Ethereum price is making an attempt to recover today, moving in sync with the market. A sustainable move above $165 will improve the technical picture.
ETH/USD Market
Key Levels:
Resistance levels: $192, $202, $212
Support levels: $120, $110, $100
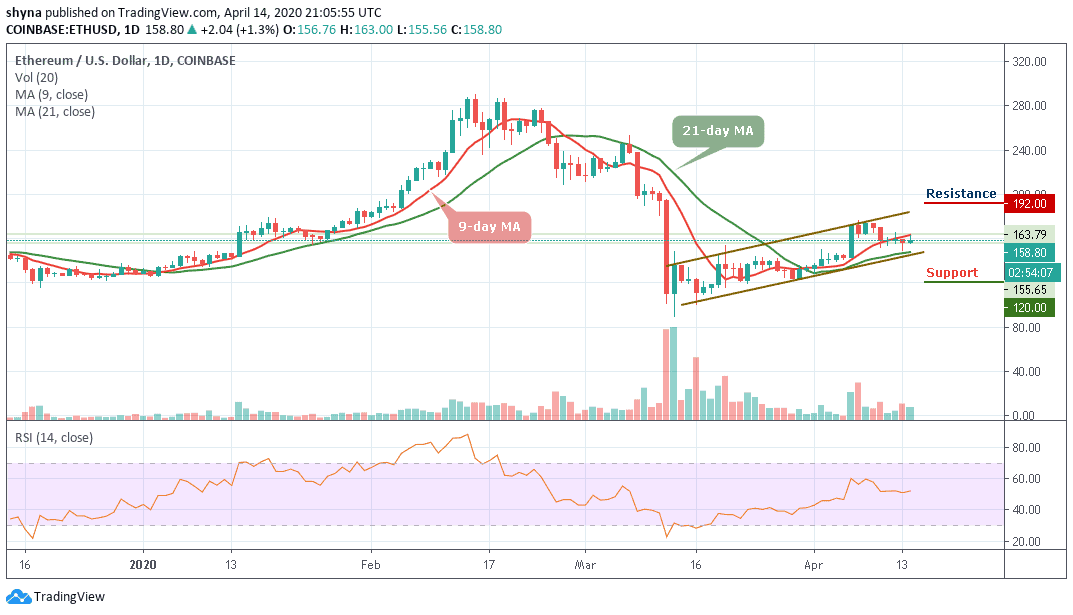
ETH/USD has touched $163.79 during early Asian hours but managed to drop to $158 where it is currently trading. The price of Ethereum (ETH) has remained unchanged on a day-to-day basis and gained nearly 1.3% since the beginning of today amid the recovery across the cryptocurrency markets.
However, the Ethereum price has continued to rise further higher until it finds resistance at the expected level of $165. Looking at the daily chart, we can see that ETH/USD may need to spike higher into the resistance level at $160. Therefore, if the buyers continue to push the market higher, the immediate resistance above the $175 level could be located. Above this, further resistance levels lie at $192, $202 and $212.
Alternatively, if the bears try to bring down the price below the 21-day moving average and possibly cross the lower boundary of the channel, the bears may experience the immediate support at $140. Below this, further support is found at $120, $110 and $100. Meanwhile, the RSI (14) is moving in the same direction, suggesting a sideways movement.
Against BTC, Ethereum is still trading above the moving averages of 9-day and 21-day within the channel and the price is now hovering at 2314 SAT as the RSI (14) moves around 56-level. Although the market remains in the sideways movement, the pair seems to be moving towards the upper boundary of the channel.
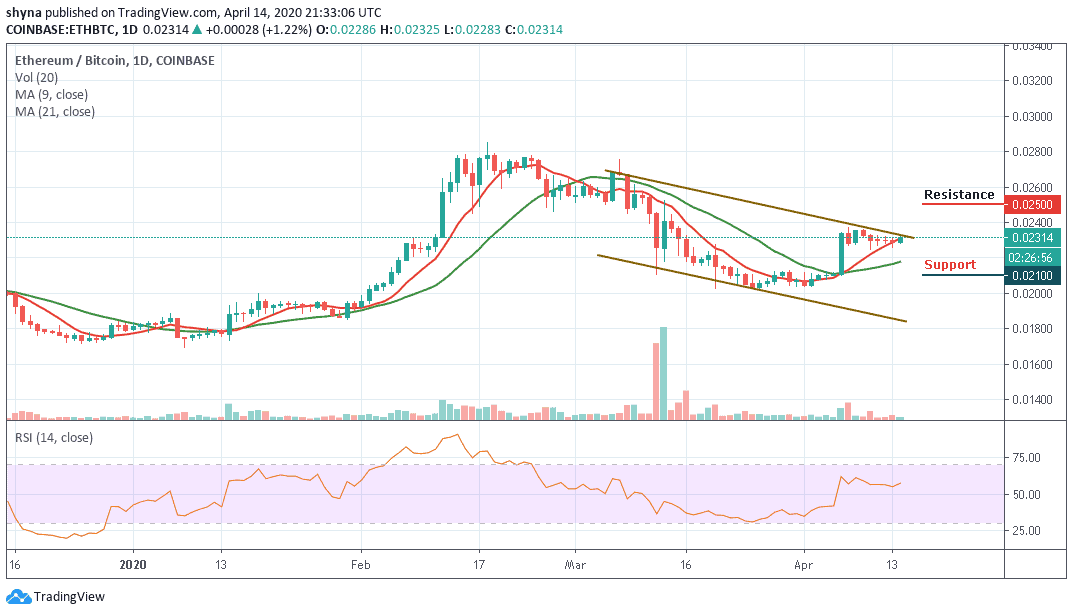
At the upside, the resistance levels to be reached are 2500 SAT and 2600 SAT. Conversely, a lower sustainable move may likely cancel the bullish pattern and this could attract new sellers to the market with the next focus on 2100 SAT and 2000 SAT support levels.
Please note: Insidebitcoins.com is not a financial advisor. Do your research before investing your funds in any financial asset or presented product or event. We are not responsible for your investing results.
Join Our Telegram channel to stay up to date on breaking news coverage