Join Our Telegram channel to stay up to date on breaking news coverage
Bitcoin (BTC) Price Prediction – November 1
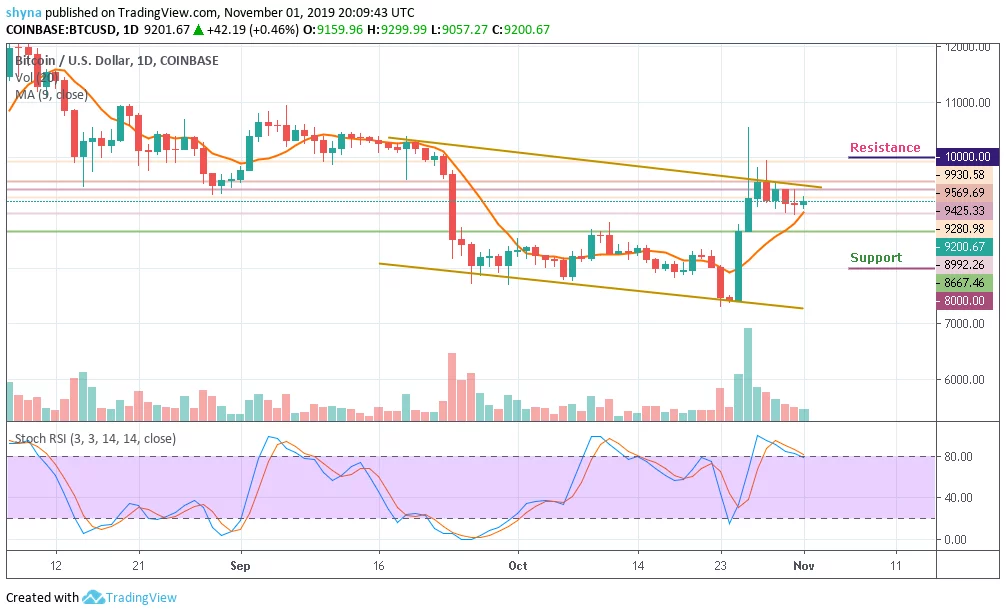
The price of Bitcoin is trading in a tight range between $8,992.26 and $9,425 for the past few days.
BTC/USD Long-term Trend: Ranging (Daily Chart)
Key levels:
Resistance Levels: $10,000, $10,500, $11,000
Support Levels: $8,000, $7,500, $7,000

The movement in the Bitcoin price has reflected improvement. If the same remains locked, then the expectation of recovery could turn out to be true. BTC/USD was seen trading at $9,200 after soaring to $9,280.98. The coin then pulled back to where it trading currently and may continue to head downwards if the bears step back into the market.
In addition, the market is deciding around $9,200 above the 9-day moving average, where the buyers are anticipating for a clear breakout. Meanwhile, the $9,570 and $9,950 levels may further surface as critical resistances should the $9,300 level holds. However, a strong bullish spike might take the price to $10,000, $10,500 and $11,000 levels.
Moreover, if the market decides to go down, Bitcoin’s price may drop to $8,500 and should this support fails to contain sell-off, we may see a further roll back to $8,000, $7,500 and potentially $7,000. The Stochastic RSI for Bitcoin price suggests an extremely overbought market. Turning downward, the market may fall to immediate supports.
BTC/USD Medium-Term Trend: Ranging (4H Chart)
BTC/USD trades within the range of $9,084 to $9,300. Nevertheless, Bitcoin has not yet slipped below $9,000 and is still in the loop of making a bounce back. BTC price hovers around $9,206.22 and may take time to persistently trade above $9,300. The upward movement is facing hurdles near the $9,500 and $10,000 resistance level.
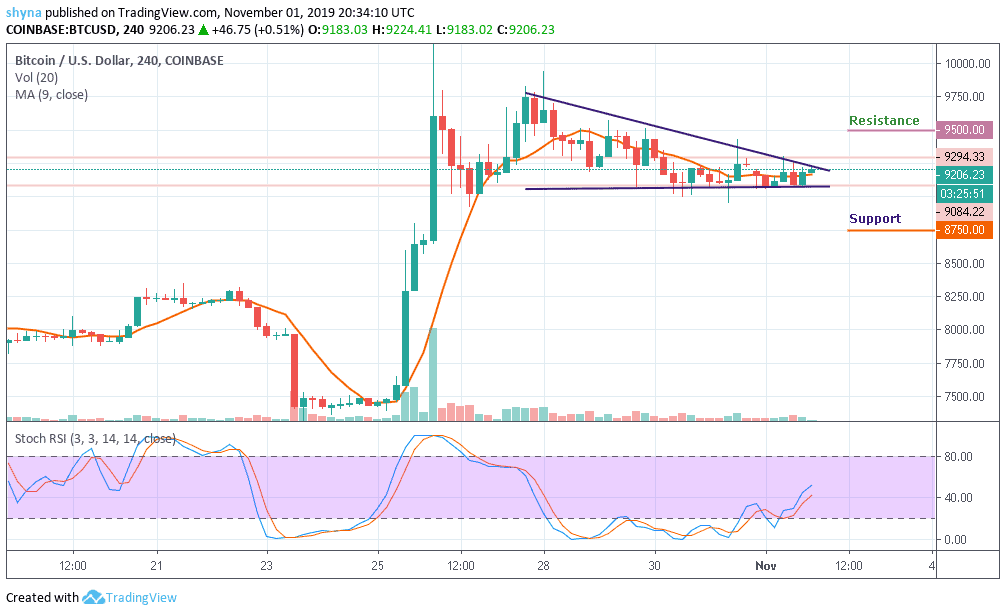
Furthermore, on the downside, immediate support is near the $9,000 level while the main support is at the $8,900 level. The price might slide sharply below $8,750 which may likely test the main support at $8,500 level. Technically, Bitcoin is currently moving in sideways while the stochastic RSI above 40-level, indicating indecisive market movement.
Please note: Insidebitcoins.com is not a financial advisor. Do your research before investing your funds in any financial asset or presented product or event. We are not responsible for your investing results.
Join Our Telegram channel to stay up to date on breaking news coverage