Join Our Telegram channel to stay up to date on breaking news coverage
Bitcoin (BTC) Price Prediction – August 4, 2020
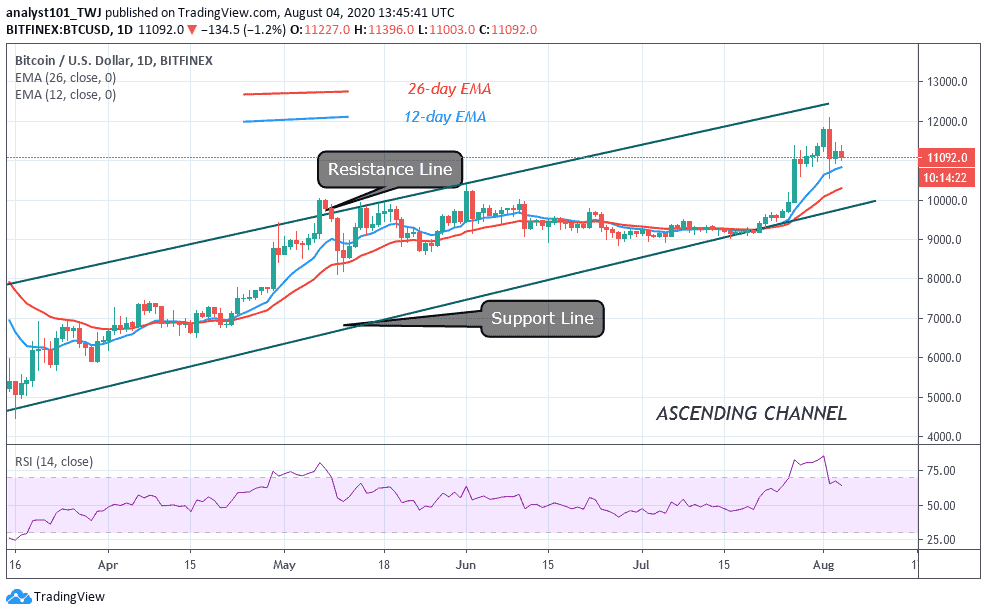
For the past three days, BTC/USD has been consolidating above $11,000. The King coin now fluctuates between $11,000 and $11,500 after the last bearish impulse.
Resistance Levels: $10,000, $11, 000, $12,000
Support Levels: $7,000, $6,000, $5,000

For the past three days, buyers are making concerted efforts to push BTC to the previous highs. The price movement has been stalled below the $11,500 resistance. Today, price has fallen to the $11,000 support after a retest at the recent resistance. The bulls are defending the current support as price resumes an upward. With the recent indicators, buyers have the chance of pushing the coin above $11,500.
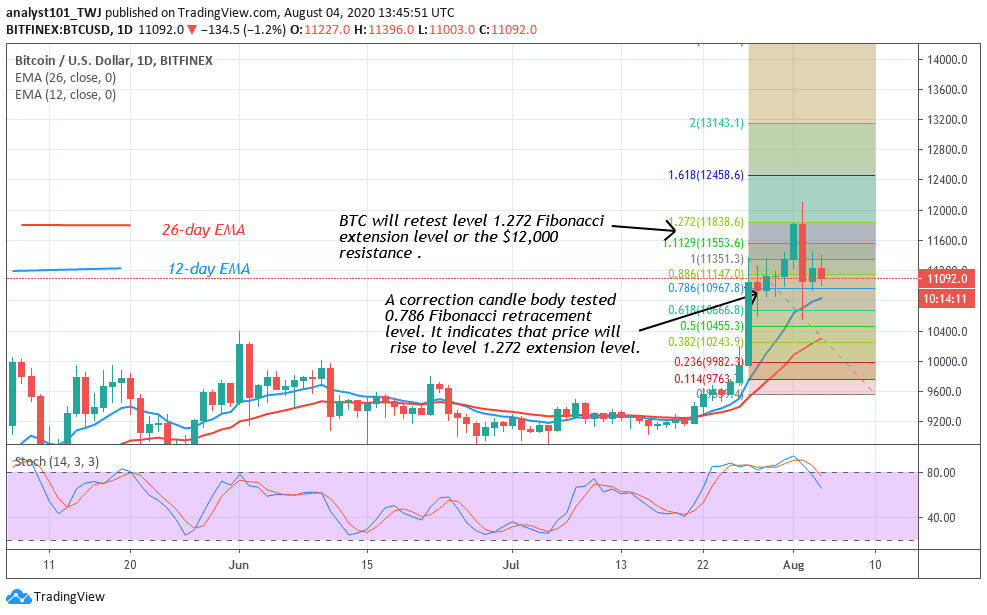
The market will rise and retest the $12,000 mark if the bulls are successful. Nevertheless, subsequent uptrend will unfold, if the $12,000 resistance is broken. Conversely, if the bears suddenly break the $11,000 support, price will drop again to $10,500. In the meantime, price is falling and approaching the current support. The king coin is below 80% range of the daily stochastic. The market is still in a bearish momentum after the recent crash.
Correlation between Bitcoin Price and Stocks May Affect Bitcoin Bull’s Run
According to reports, Bitcoin has high correlation with the stock markets, particularly S&P 500. Despite the recent breakdown, Bitcoin has shown some signs of bullish gains and a possible retest of the $12,000 mark. Analysts believed that Bitcoin will still be at risk of these traditional markets. A crash in the traditional market has been forecasted by analysts which could affect Bitcoin bulls’ run. The stock’s market in the middle of March resulted in Bitcoin’s price fall by 40%. Investors have been advised to be cautious in their investment.

BTC/USD Next Possible Direction
Bitcoin is still consolidating above the $11,000 support. According to the price action, the market will retest the $12,000 resistance when the uptrend resumes. In July 27 uptrend, a red candle body tested the 0.786 Fibonacci retracement level. This gives the impression that price will rise to level 1.272 extension level. In other words, the market will retest the $12,000 resistance. Traders should buy if the current support holds.
Join Our Telegram channel to stay up to date on breaking news coverage

