Join Our Telegram channel to stay up to date on breaking news coverage
Bitcoin Price Prediction – March 11
After significant downward correctional moves in the valuation of BTC/USD trading days’ sessions, the flagship crypto-economy now trades closely below the market-worth of $60,000 as seemingly did around February 21.
BTC/USD Market
Key Levels:
Resistance levels: $60,000, $65,000, $70,000,
Support levels: $45,000, $40,000, $35,000
BTC/USD – Daily Chart
On March 1, a bullish candlestick occurred and, it bottomed on the support of a $45,000 line to signal a recovery move of the crypto-market. As a result of that, the bullish trend-line finds a good shape of taking a place on the daily trading chart in support of sentiment that some buying activities are ongoing. The two SMA-trading indicators are separated with a visible space as the 14-day SMA is located over the 50-day SMA. And, they are pointing to the north underneath the current market trading zone. The Stochastic Oscillators have penetrated the overbought region as they attempt to cross the hairs within it. All of that showcases that buying spree in the crypto-trade is yet to be exhausted.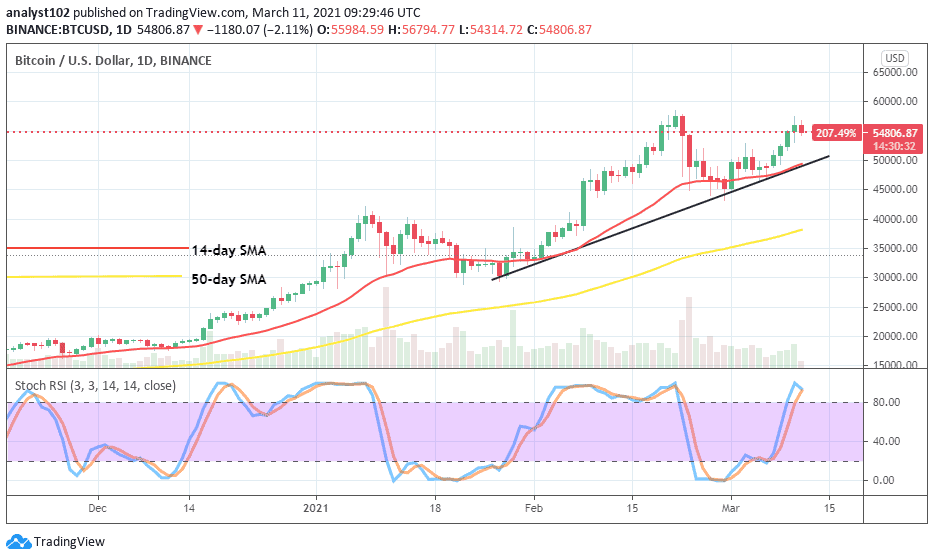 Will BTC/USD market survive surging past the $60,000 resistance line?
As there has been another critical line of $45,000 from which BTC/USD bulls have been able to make a mark of springing once again northward, it is now expected that in a near trading time, the bullish trend will push northward and extend beyond the $60,000 current key resistance line. Meanwhile, price may keep trading around the levels of $55,000 and $50,000 for a while in a brief-formation of witnessing lower highs around the presumed trading zones.
On the flip side, a touch or reversal move of the key resistance point of $60,000 could lead to giving back the market advantage to bears to come in once again. While that assumption comes to play, bears may not have the capacity to forcefully push past vital support of $45,000 sustainably. Being as it is, a good sell-signal has not formed and, it has come with a daily fully-formed-body candlestick around a high market-point before a decent suggestion can be raised.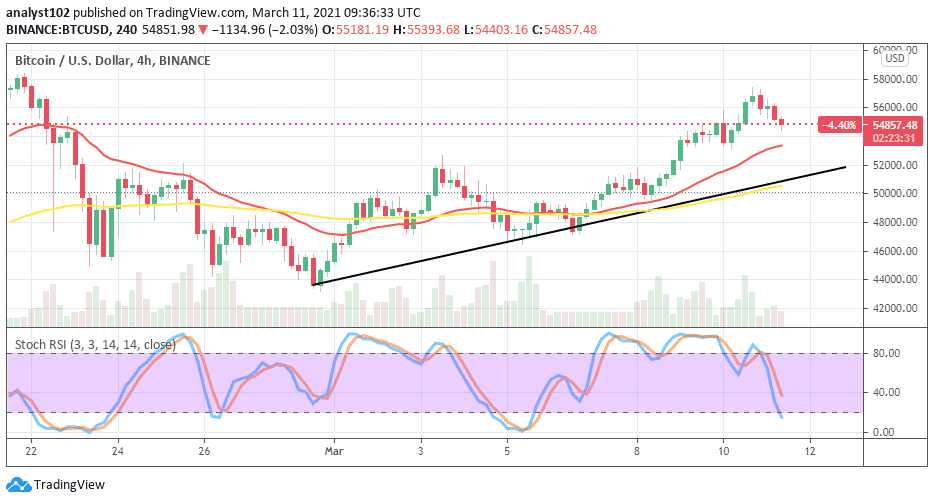
BTC/USD 4-hour Chart
The BTC/USD 4hour-hour trading chart shows a line of ups and downs briefly in the recent trading sessions past. On March 6, the crypto muscled up against the US dollar to rise from $47,500 to a high of $57,500, yesterday. Now, price trades around $55,000 level. The 14-day SMA is above the 50-day SMA. And, they underneath the current market trading point. That indicates that bulls are in control of the market. The Stochastic Oscillators have moved towards range 20 to seemingly attempt to cross the hairs. That suggests a limit to seeing decent bearish position-taking at this point.
Join Our Telegram channel to stay up to date on breaking news coverage