Join Our Telegram channel to stay up to date on breaking news coverage
Bitcoin (BTC) Price Prediction – February 16
Bitcoin appears to have dropped to a low of $9,800. One of the reasons is that BTC was previously in the overbought condition of the daily Relative Strength Index. Another reason is that the bulls fail to break the next major resistance at $10,400.
BTC/USD Long-term Trend: Bearish (Daily Chart)
Key Levels:
Resistance Levels: $10,000, $11,000, $12000
Support Levels: $7000, $6000, $5000
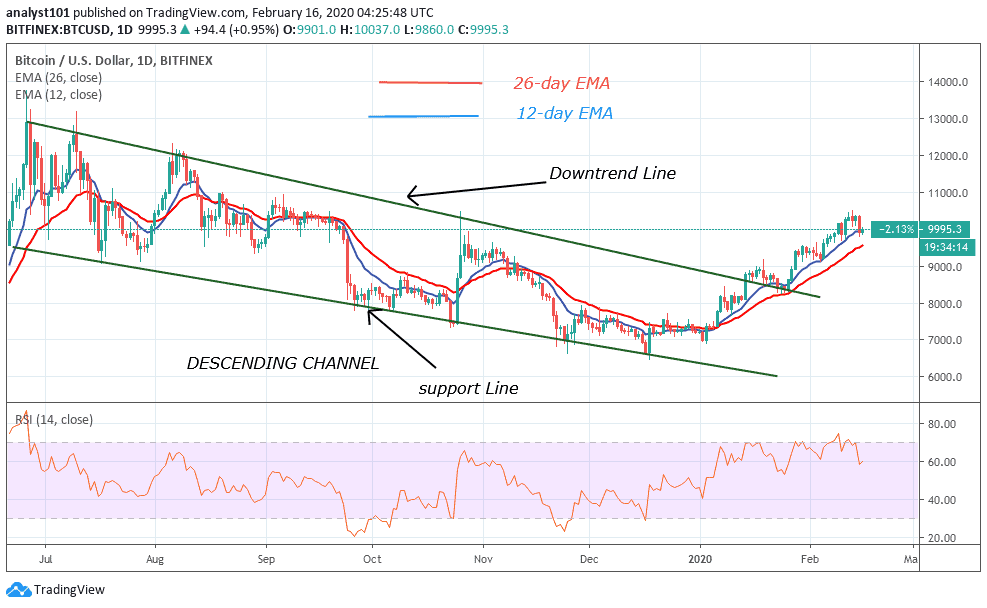
Today, BTC/USD retraced to the low of $9, 800 which incidentally is the next support after a retracement. It was earlier anticipated that if the bulls break the resistance at $10,400, the coin will rally above $11,500. On the other hand, if the bulls fail to penetrate the resistance level, the coin will fall to a low of $9,800. Undeniably, BTC ought to rebound at a low of $9,800. The previous rebound at the low of $9,100 resulted in the bulls reaching a high of $9,800. Today, if the coin rebounds at the $9,800 low, BTC will reach a high of $10.400. Nonetheless, if the current low continues its downward move, the coin will fall the low of $9,100.
At the moment, the pair is trading at level 58 of the Relative Strength Index period 14. It means that Bitcoin is in the uptrend zone. It is also above the centerline 50 which means it is likely to rise. The pair fell to the support of the 12-day EMA. Bitcoin will rise again if the 12-day EMA support holds.
BTC/USD Medium-term Trend: Ranging (4-Hour Chart)
On the 4-hour chart, Bitcoin fell to the support of the trend line. Presently, the price is consolidating above the trend line. Bitcoin will rebound above the support of the trend line if the support holds. The rebound is expected to reach the next resistance at $10,400.
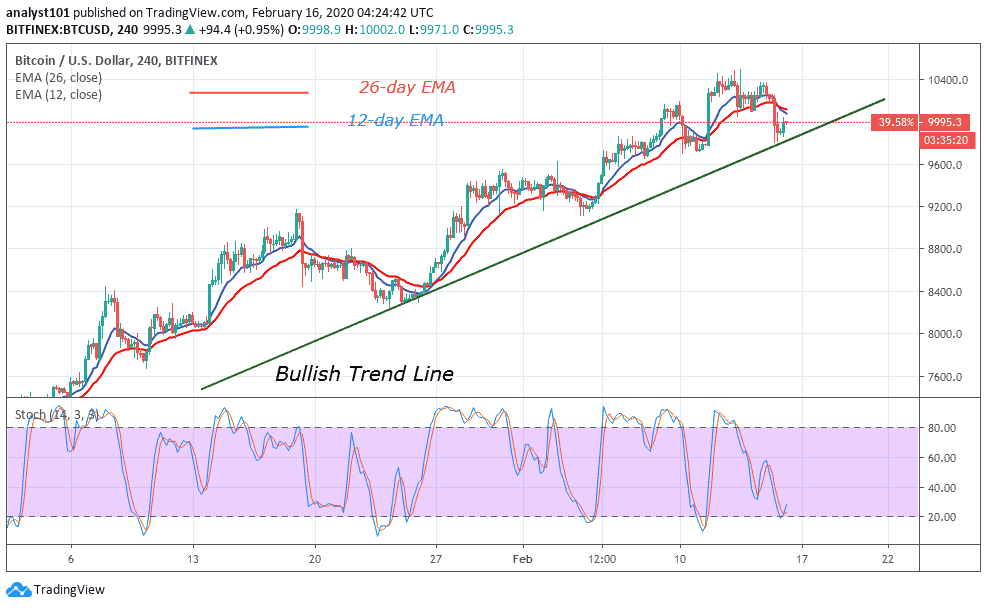
Conversely, if the bears break below the trend line, the downtrend will resume. The coin will fall to a low of $9,200 and then $8,400. Meanwhile, BTC is above 20% range of the daily stochastic indicating that the coin is in bullish momentum. The rise of Bitcoin is expected.
Please note: Insidebitcoins.com is not a financial advisor. Do your research before investing your funds in any financial asset or presented product or event. We are not responsible for your investing results.
Join Our Telegram channel to stay up to date on breaking news coverage