Join Our Telegram channel to stay up to date on breaking news coverage
BCH Price Prediction – February 15
Today, the Bitcoin Cash (BCH) retreats to test $400 support ahead of the breakout to $500. This is necessary for the next rally as long as the $400 support is not broken.
BCH/USD Market
Key Levels:
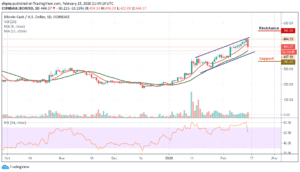
Resistance levels: $550, $570, $590
Support levels: $350, $330, $310

Despite maintaining a bullish movement for the past few weeks, it looks like BCH/USD is looking to slow down and settle around the $430 level. The market broke down today, touching its lowest daily level at $417.50. The current performance of the coin in the market is below the normal expectations of traders and the coin could soon recover from this downtrend.
Meanwhile, BCH/USD is currently trading at $444; the daily chart shows that the coin is trading in-between the 9-day and 21-day moving averages within the ascending channel. As at the time of writing, the market price nosedive and touched the green-line of the 21-day moving average, issuing a sell signal as the RSI (14) moves toward the 60-level.
Moreover, a minimum swing may likely push the market to a $400 level of support. Exceeding this level could take the bears to $350, $330 and $310 levels by crossing the lower trend line of the channel. In other words, a high swing may likely take the bulls to a key resistance level of $500. Above this, the coin can possibly trigger a bullish rally which may take the price to $550, $570 and $590 resistance levels.
When compared with BTC, the daily chart reveals that the sellers have started showing some commitment to BCH trading because of the recent rise of BTC. However, following the recent negative signs, the trend may continue to go down if the bears continue to put more pressure on the market.
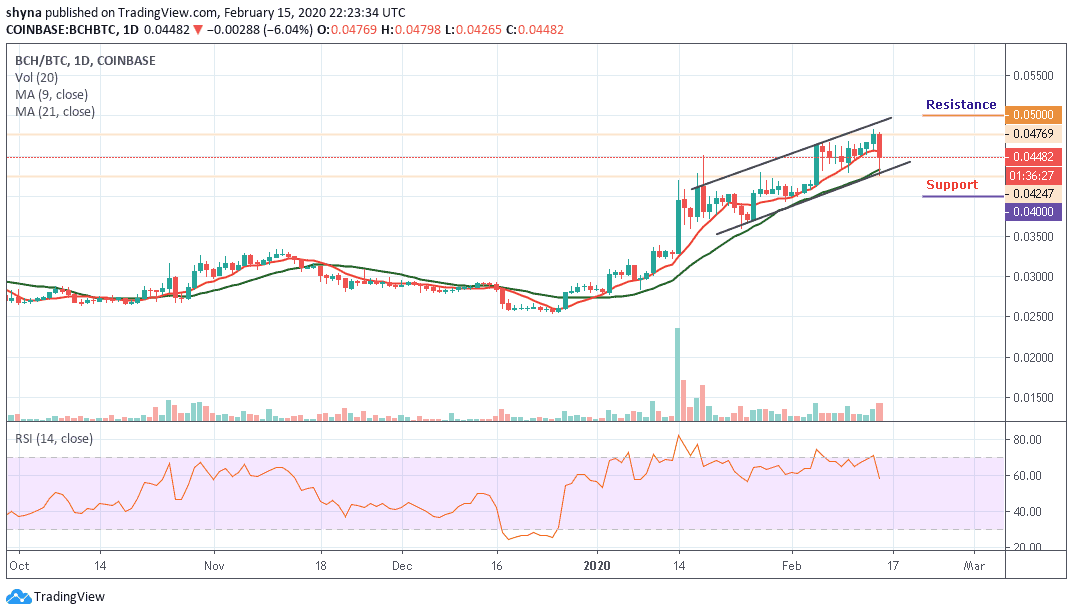
Moreover, as the RSI (14) signal line moves below 60-level, if the buyers failed to hold the support of 0.0420 BTC, the market price may likely halt the upward movement and focus on the downtrend, pushing it below the channel may bring it to the nearest supports at 0.0400 BTC and 0.0380 BTC but a rebound could take the price to 0.0500 BTC and 0.0520 BTC resistance levels.
Please note: Insidebitcoins.com is not a financial advisor. Do your research before investing your funds in any financial asset or presented product or event. We are not responsible for your investing results.
Join Our Telegram channel to stay up to date on breaking news coverage