Join Our Telegram channel to stay up to date on breaking news coverage
Bitcoin (BTC) Price Prediction – June 23
At the moment, BTC/USD dropped by a total of 0.18% within 24 hours as it trades at the $9,673 level.
BTC/USD Long-term Trend: Bullish (Daily Chart)
Key levels:
Resistance Levels: $10,400, $10,600, $10,800
Support Levels: $8,600, $8,400, $8,200
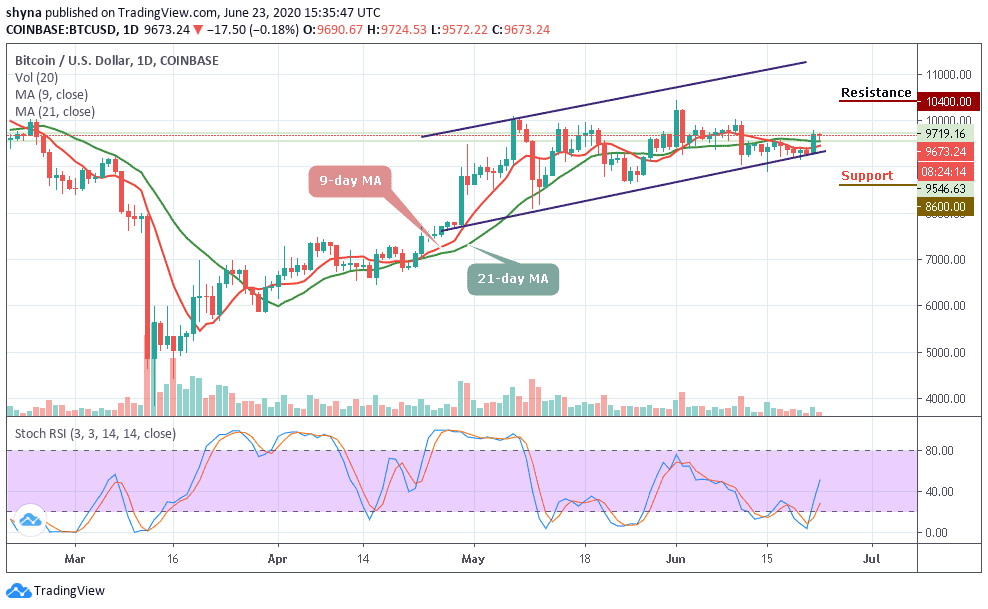
Today, the daily chart reveals a sharp decline in Bitcoin price below the $9,700 support against the US Dollar. BTC/USD pair is settling below this level above the 9-day and 21-day moving averages. The Bitcoin price is consolidating losses above the $9,600 level and currently trading at $9,673. Similarly, the first level of support is located in the moving averages.
However, BTC/USD is technically supported by the $9,546 on short-term and $9,500 support in the medium-term. If the price of Bitcoin drops below these supports, we should expect long-term support at the $9,000. More so, any further movement below the lower boundary of the channel may lead to support levels of $8,600, $8,400, and $8,200 respectively.
However, if the buyers can reinforce and power the market, we can expect a retest at the $10,000 resistance level. Breaking the mentioned resistance may further allow the bulls to test the potential resistance at $10,400, $10,600, and $10,800 on the upside. However, as the stochastic RSI moves out of the oversold zone, the price of Bitcoin is currently consolidating and moving in sideways on the long-term outlook.
BTC/USD Medium-Term Trend: Bullish (4H Chart)
BTC/USD is now trading around $9,659 after touching $9,799 yesterday. Looking at the hourly price chart, we can see that the bearish supply is coming in the market slowly, but the bulls are also trying to defend the $9,600 support. Meanwhile, the $9,500 support level and below may come into play if BTC breaks the mentioned support.
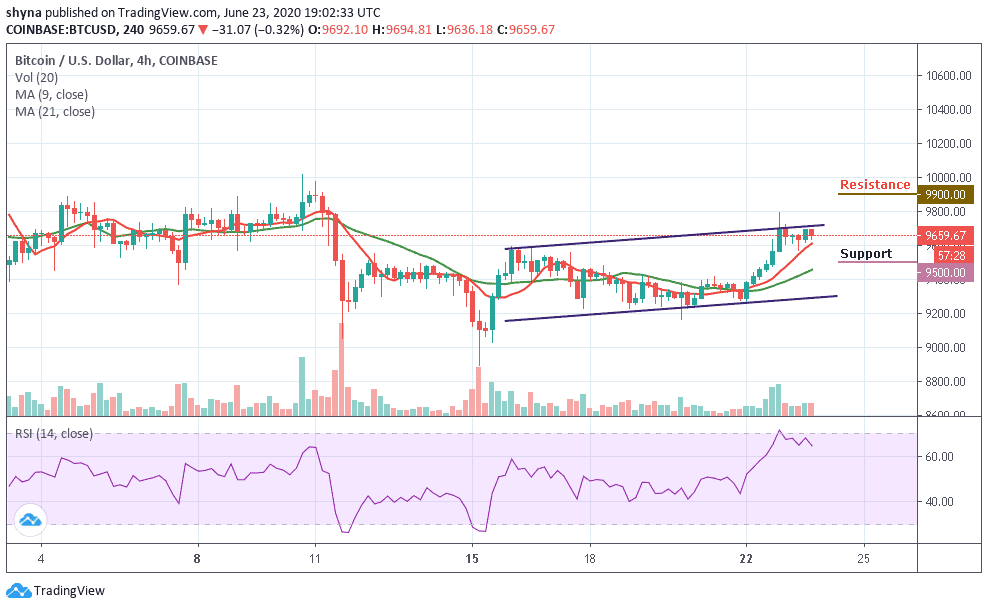
However, if buyers can strengthen and energize the market, we can expect a retest of $9,799 resistance level. Therefore, breaking the mentioned resistance could also allow the bulls to test the $9,900 and $10,100 upward. However, BTC/USD is consolidating and moving in sideways on the medium-term outlook.
Join Our Telegram channel to stay up to date on breaking news coverage