Join Our Telegram channel to stay up to date on breaking news coverage
Bitcoin (BTC) Price Prediction – August 13, 2020
Yesterday, Bitcoin dropped to $11,123 low but recovered as price reached a high of $11,600. Today, BTC/USD is falling again after facing rejection at the $11,600 high. The king coin is recovering after the initial fall.
Resistance Levels: $10,000, $11, 000, $12,000
Support Levels: $7,000, $6,000, $5,000
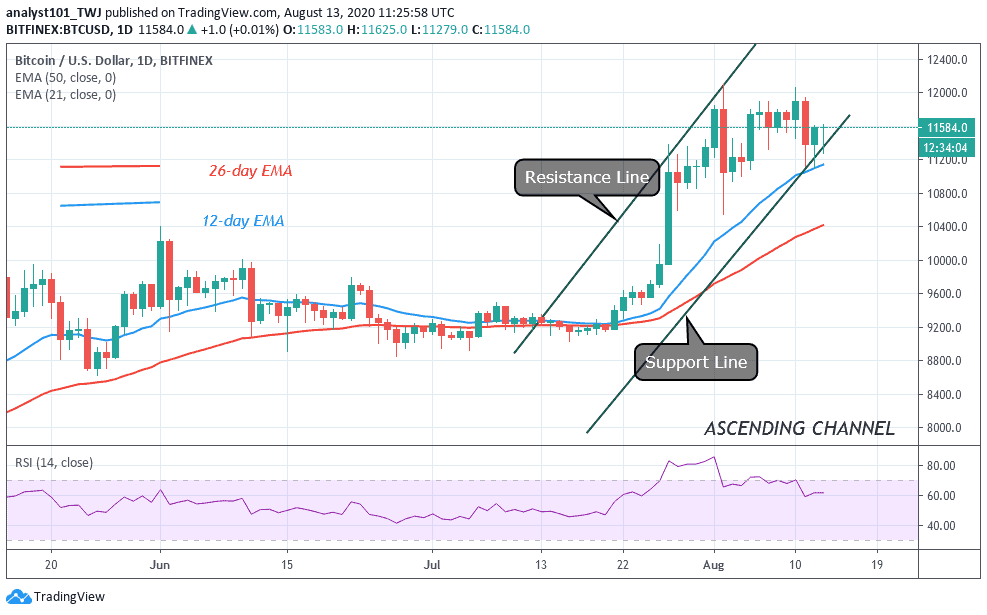
It is unlikely if Bitcoin will continue with the downward move as all indicators are pointing an upward move. Bitcoin bulls are presently facing rejection at the $11,600 and $11,800 besides the overhead resistance. The current selling pressure has subsided as price moves up. As price moves and bounces, the current resistance at $11,600 can be breached.
When price bounces, it increases the possibility of an upward move. As the market moves up and break up the minor resistance at $11,600, the momentum will pick up to retest the $12,000 overhead resistance. Bitcoin bulls’ next target will be at $13,000, if BTC closed above the overhead resistance. The bullish scenario will continue as long as price does not fall into the support zone of $10,000 and $10,400.
Looming Price Rally of up to 200%
A major U.S based crypto exchange Kraken has released a report indicating that Bitcoin will rally between 50% and 200% in a couple of months to come. According to Kraken between July 27 and July 31, Bitcoin’s overall performance increased from 14.5% to 24% gain. According to reports, August has been the most volatile month for BTC price fluctuations. The reports concluded that upward momentum produced by Bitcoin in the month of July will continue for several months.
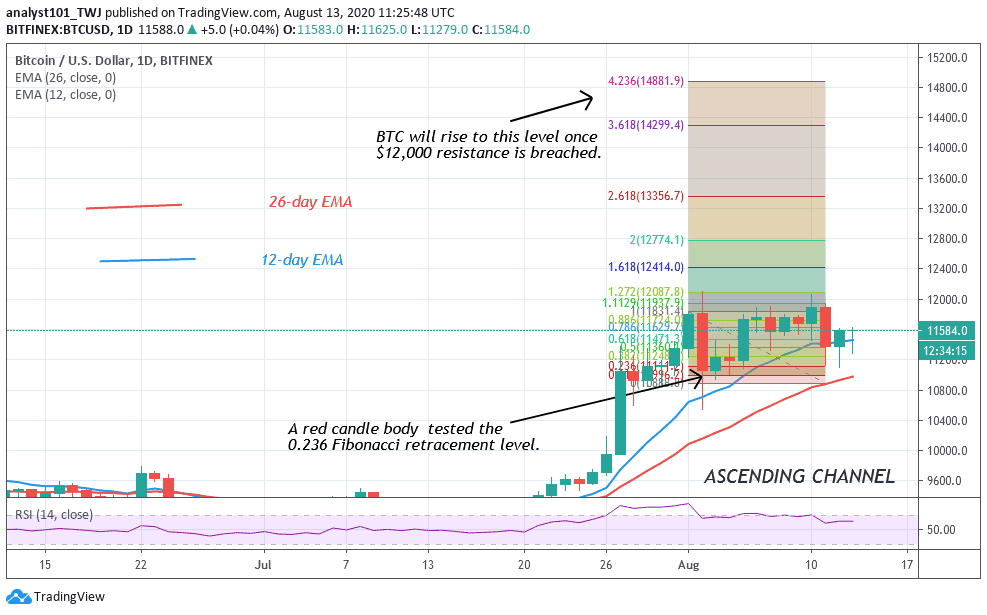
Meanwhile, the Bitcoin uptrend is intact despite the recent downward move. Price fluctuations are ongoing below the $12,000 overhead resistance. According to the Fibonacci tool, the market will rise to $15,000 after the $12,000 resistance is breached. On August 1 uptrend; a red candle body tested the 0.236 or 23.6% Fibonacci retracement level. This retracement gives the clue that the market will reach the $15000 high.
Join Our Telegram channel to stay up to date on breaking news coverage