Join Our Telegram channel to stay up to date on breaking news coverage
Bitcoin (BTC) Price Prediction – June 18
BTC/USD price is slowly approaching crucial supports and the bears need to be very careful once the price reaches the $9,200 support level.
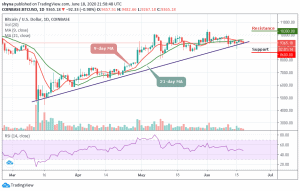
BTC/USD Long-term Trend: Bullish (Daily Chart)
Key levels:
Resistance Levels: $10,300, $10,500, $10,700
Support Levels: $8,600, $8,400, $8,200

BTC/USD has been struggling to maintain its position above $9,500 but its price saw another dive below the $9,400 mark today. The coin is in a dangerous position as the price may slip below the critical supports. If the breakthrough is confirmed, the downside momentum will gain traction with the next focus on $9,300. At the time of writing, Bitcoin is trading below the moving averages of 9-day and 21-day at $9,365.
Moreover, looking at the price movement of BTC since the beginning of the month, we can see that the coin has been moving up and down. BTC/USD started the month trading at $9,432 and reached $10,422 before starting the downward journey. The recent downtrend is such that the price is even trading below the $9,432 support. It traded close to the $8,898 support level where a new monthly low was formed a couple of days ago.
However, should BTC price failed to move up; we may see a price cut to $9,000 vital support. A further low drive could send the price to $8,600, $8,400, and $8,200 support levels while the resistance levels to watch are $10,300, $10,500, and $10,700. The RSI (14) indicator suggesting a probable bearish movement in the near future as the signal line is moving below the 50-level.
BTC/USD Medium – Term Trend: Bearish (4H Chart)
Looking at the 4-hour chart, the bears have been dominating the market tremendously, but the bulls are trying to defend the $9,300 support as well. Meanwhile, the $9,100 and below may come into play if BTC breaks below the mentioned support.
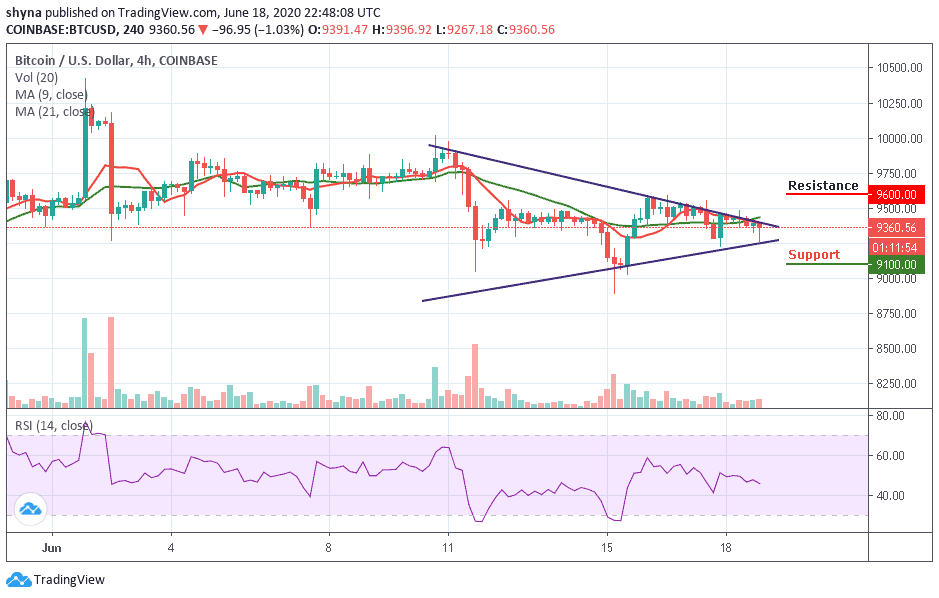
Meanwhile, in as much as the buyers can reinforce and power the market, traders may expect a retest at $9,500 resistance level above the 9-day and 21-day moving averages while breaking this level may further allow the bulls to reach $9,600 and above. The RSI (14) is moving around the 45-level which may cause the market to fall more.
Please note: Insidebitcoins.com is not a financial advisor. Do your research before investing your funds in any financial asset or presented product or event. We are not responsible for your investing results.
Join Our Telegram channel to stay up to date on breaking news coverage