Join Our Telegram channel to stay up to date on breaking news coverage
Bitcoin (BTC) Price Prediction – August 2, 2020
Today, BTC/USD retested the $12,000 resistance to reach a high of $12,097. The king coin suffered a bearish reaction as it crashed to $10,548 low. After crashing to $10,500 support, price corrected upward to $11,400.
Resistance Levels: $10,000, $11, 000, $12,000
Support Levels: $7,000, $6,000, $5,000
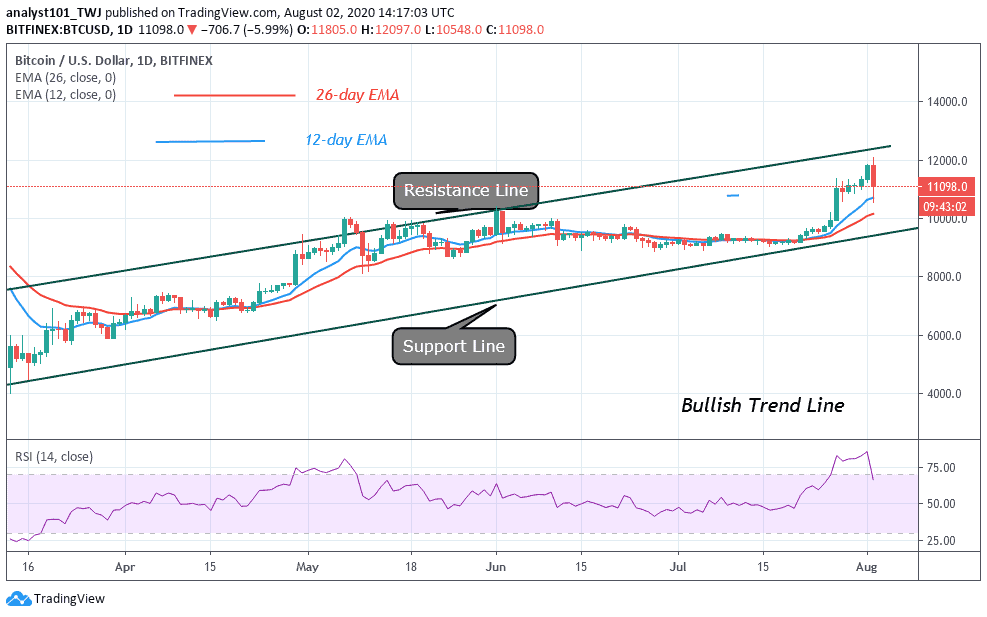
The recent uptrend of Bitcoin was made possible after the bulls break the $10,000, and $10,500 resistance. The price movement was accelerated as the market reached $12,000 high. Nevertheless, after price retested the $11,400 high, the downtrend resumed. In the interim, the market is fluctuating above $11,000. Besides, price fell and found support above the exponential moving averages.
Bitcoin has the chance of resuming a fresh uptrend if the current support above the EMAs hold. On the 4-hour chart, the market retested the $11,400 high but found support above $11,000. On the downside, if the current support fails to hold, the market will drop to $10,500 low. BTC is in a bearish momentum as price is below 75% range of the daily stochastic.
Why Bitcoin Price liquidated $1 billion worth of futures contracts
The sudden crash of Bitcoin to $10,548 low as liquidated $1 billion worth of futures contract. According to some reports, there are many factors responsible for the Bitcoin crash. Reports have it that the volume of the cryptocurrency market tends to drop during the weekend. Also, the market was heavily influenced by buyers. The bottom line is that liquidity tends to drop during these periods as there are few traders in the market. Typically, low volumes often lead to massive price movements. This is the reason why cryptocurrencies are the most defenseless.

BTC/USD Next Possible Direction
The recent downtrend may find support above $11,000. A correction candle body tested 0.618 Fibonacci retracement level. It indicates that price will rise to level 1.618 Fibonacci extension level. In other words, the market will retest the $12,000 resistance. Traders should buy if the current support holds above $11,000.
Join Our Telegram channel to stay up to date on breaking news coverage