Join Our Telegram channel to stay up to date on breaking news coverage
Bitcoin Price Prediction – January 24
BTC/USD market has continually poised to respect some falling pressures since January 10 when it could not surge higher sustainably past a critical resistance price value built up around the immediate $40,000.00 resistance.
BTC/USD Market
Key Levels:
Resistance levels: $40,000, $44,000, $48,000
Support levels: $28,000, $24,000, $22,000
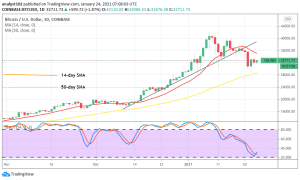
BTC/USD – Daily Chart
There has now been a formation of significant bearish candlesticks cutting across the 14-day SMA trend-line down to the south-direction. Price now hovers around $32,000 level under the smaller SMA trading indicator. The 50-day SMA trend-line is around the immediate support level to solidify a point against further downward pressure. The Stochastic Oscillators have moved southward closer to range 20. They have slightly crossed hairs to the north and, that could be a sign of short-pedaling the downward moves as at the time of writing. 
Where is BTC/USD Price Going Next?
BTC/USD needs to find or build up muscles around the $28,000 support level in their bid for a bullish trend resumption and continuation above the previous most-high value. A quick reversal move of any spike around $36,000 and $40,000 price resistances could lead bulls’ forces lowering southbound to revisit a low at the $28,000 support zone.
Looking at the downside, bears need to put up with a consolidating-moving mode to see that market levels between $32,000 and $28,000 are forcefully breached southward in other to give a clear-cut in of a bearish move continuation that may eventually get a lower value around $22,000 or $20,000 marks.
BTC/USD 4-hour Chart
The 4-hour trading chart shows that there have been a slight-notable number of downs than ups in the BTC/USD market operations over a week and some days. The SMA indicators have crossed southwards in a usual manner seeing the bigger trend-line above the smaller’s to attest to the relative downward pressures. Price had once traded below a low point at $30,000, now trades around $32,000 level along with the 14-day SMA trend-line. The 50-day SMA is around the value of $35,000. The Stochastic Oscillators have moved slantingly northbound near range 80. That suggests an ongoing slow-rise in the crypto-trade. Therefore, traders need to take a break-off for a while until the return of active price action.
Join Our Telegram channel to stay up to date on breaking news coverage