Join Our Telegram channel to stay up to date on breaking news coverage
Bitcoin (BTC) Price Prediction – July 5, 2020
Yesterday, BTC/USD rebounded after fluctuating above $9,000 for days. The coin reached a high of $9,200 but retraced and found support above $9,100. In the last 24 hours, the market has been consolidating above $9,100. During consolidation, price movement will be stalled as the volume will decrease. A new trend will take shape as price continues consolidation.
Key Levels:
Resistance Levels: $10,000, $11, 000, $12,000
Support Levels: $7,000, $6,000, $5,000
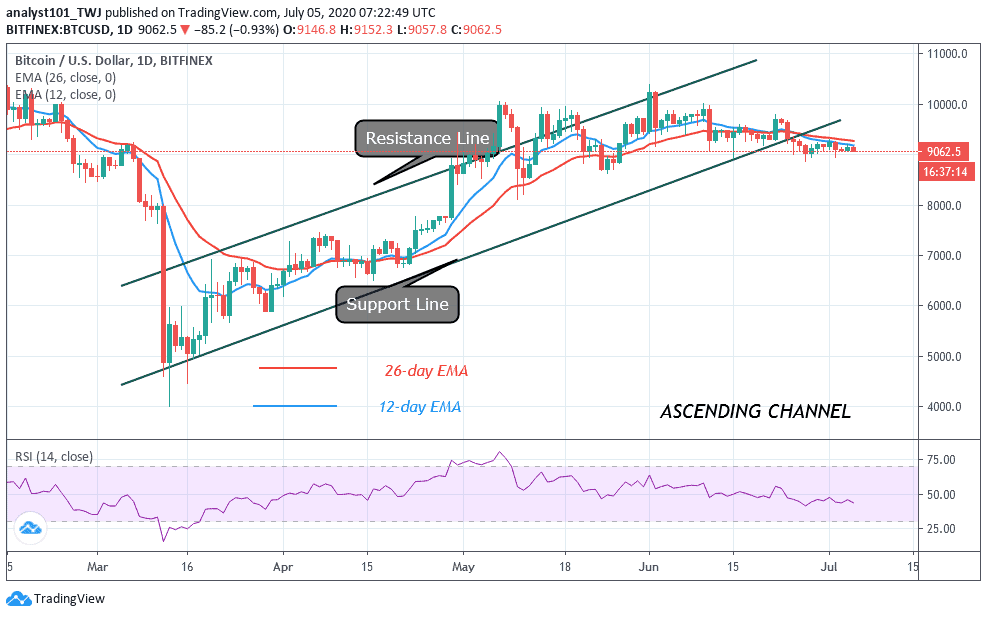
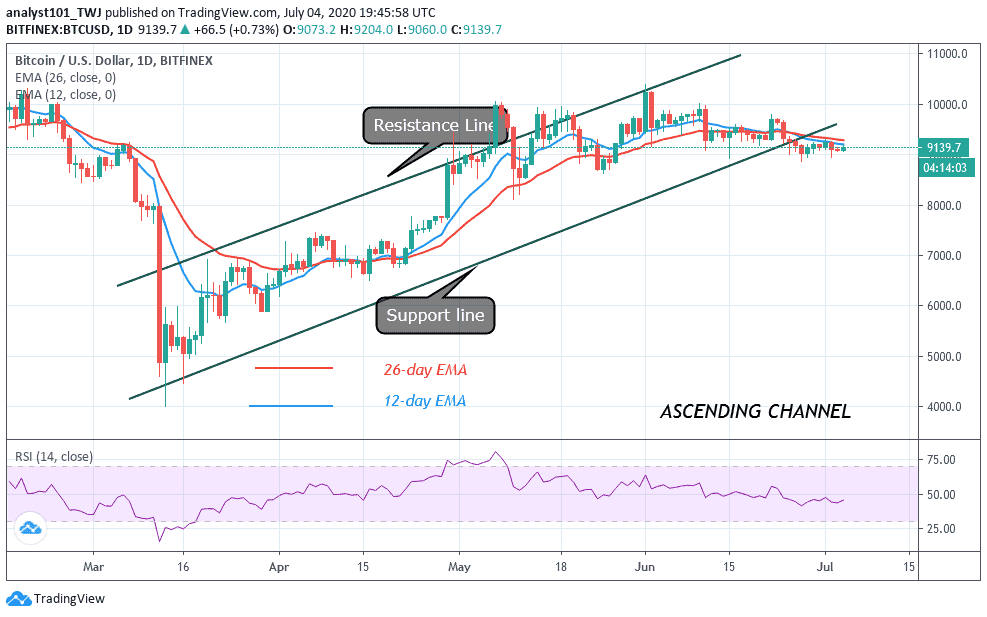
Today, the king coin is trading at $9,062 after the coin rebounded to reach the $9,200 resistance. BTC has been repelled as price consolidates above $9,000. In the last breakdown on June 27, BTC fell to $8,825 low. It rebounded and reached a high of $9,181. After consolidation for a few days, BTC broke the current consolidation to reach a high of $9,300. The bulls failed to break the resistance at $9,300 on July 1. Consequently, BTC encountered another bearish reaction as it dropped to $9,033 low.
On July 1, if buyers were successful above $9,300, the upside range trading would have commenced. Today, BTC is consolidating for another possible rebound. The king coin may rise again but will be in jeopardy if it fails to break the current resistance at $9,200. The price bars are below the 12-day EMA and the 26-day EMA which suggests a possible downward move of the coin. Bitcoin is at level 45 of the Relative Strength Index period 14. This implies that BTC is still in the bearish trend zone and it is likely to fall.
BTC/USD Medium-term Trend: Bullish (4-Hour Chart)
On the 4 hour chart, the bears have broken the current consolidation above $9,100. The market has fallen and it is approaching the $9,000 region.
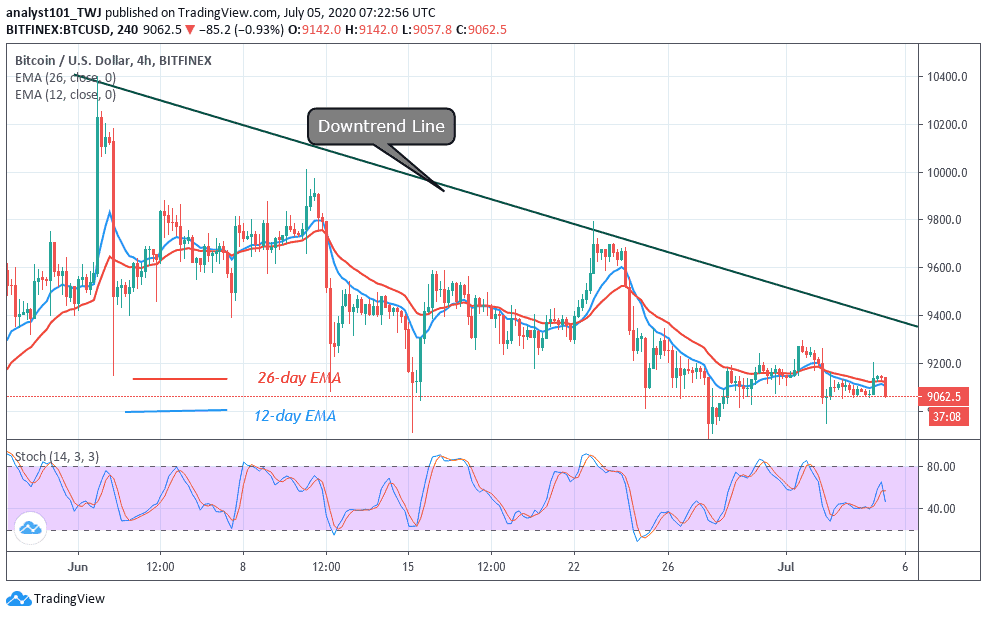
A break below $8,900 support will signal the resumption of the downtrend. Bitcoin is likely to drop sharply to $8,800 or $8,600 because these levels have been tested repeatedly. As price continues its downward move, we should expect a breakdown or another rebound. This has been the market scenario since Bitcoin resumed its sideways trading between $9,000 and $10,000. BTC is presently below 60 % range of the daily stochastic. It indicates that the market is in a bearish momentum.
Join Our Telegram channel to stay up to date on breaking news coverage