Join Our Telegram channel to stay up to date on breaking news coverage
Bitcoin (BTC) Price Prediction – March 15
Bitcoin (BTC) has tough days as the coin had lost over 40% of its value over the past four days.
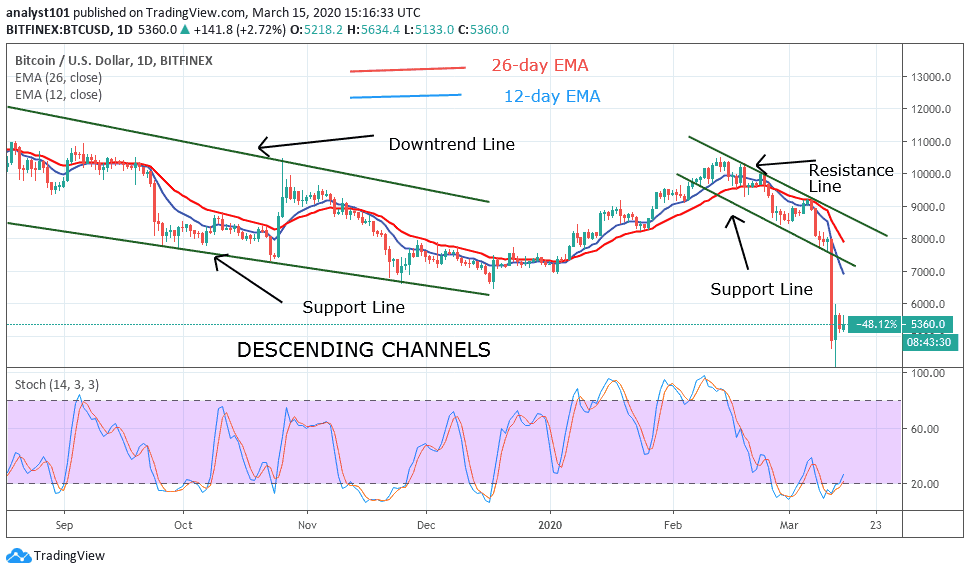
BTC/USD Long-term Trend: Bearish (Daily Chart)
Key levels:
Resistance Levels: $6,800, $7,000, $7,200
Support Levels: $3,800, $3,600, $3,400

At the time of writing, the BTC/USD price is trying to settle above $7,000, but what direction will BTC head next? The fact is that there is no consensus; since the BTC/USD bounced off a historic upward trend, it may likely enter back into a bull phase but if the coin tries to retest the $4,000 low, it may collapse further to form a longer-term bear sequence.
Moreover, as the coin is trading at $5,294 displaying an intraday loss of 2.5%. The prevailing trend is still bearish with expanding volatility. Meanwhile, a break down below the channel may likely begin to form an additional trend. In this case, Bitcoin could fall below $4,500 support and further movement may hit the critical supports at $3,800, $3,600 and $3,400.
However, should the bulls hold the price and push it above the $6,000; further bullish movement could rise towards the 9-day moving average at a vital resistance level of $6,500. A further high drive could send the coin to $6,800, $7,000 and $7,200 resistance levels. More so, the stochastic RSI is coming out of the oversold zone, which indicates that a possible bullish momentum may play out.
BTC/USD Medium – Term Trend: Ranging (4H Chart)
On the 4-Hour chart, BTC/USD trades within the range of $5,052 to $5,812. Nevertheless, Bitcoin has not yet slipped below $5,000 and still in the loop of breaking or making a bounce back. BTC price hovers around $5,353 and may take time to persistently trade above $5,500. The upward movement may be able to near the $6,000 and $6,200 resistance levels if the bulls regroup.
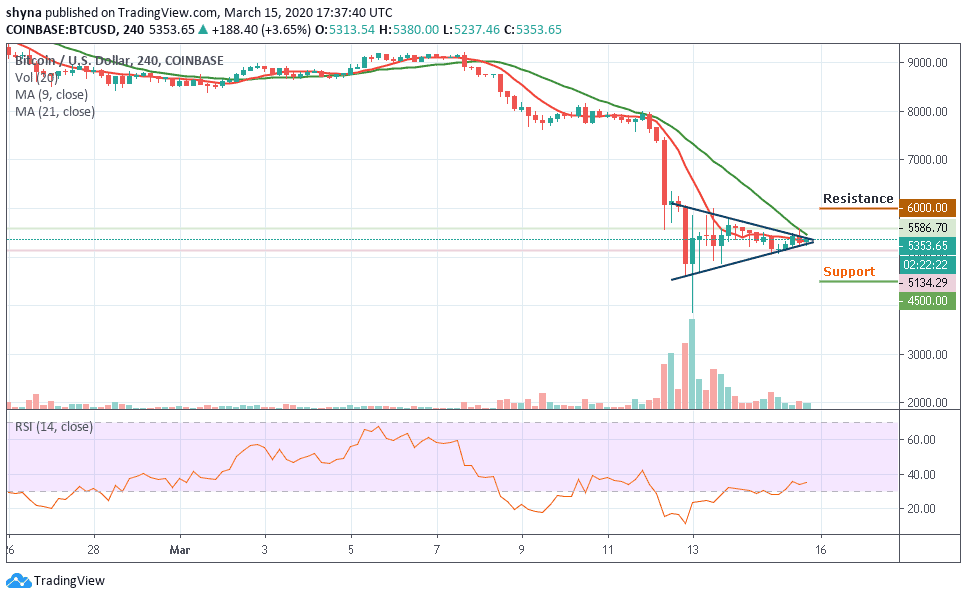
However, on the downside, immediate support is around the $5,000 level while the main support is at the $4,800 level. The price may likely fall below $4,500 if the bears step back into the market, a further movement could test the critical support at $4,300 level. Technically, Bitcoin is currently moving in sideways while the RSI (14) moves in the same direction, indicating an indecisive in the market movement.
Please note: Insidebitcoins.com is not a financial advisor. Do your research before investing your funds in any financial asset or presented product or event. We are not responsible for your investing results.
Join Our Telegram channel to stay up to date on breaking news coverage