Join Our Telegram channel to stay up to date on breaking news coverage
Bitcoin (BTC) Price Prediction – March 19
As the movement to the north is gradual, the technical indicator RSI (14) shows that the buyers have an upper hand.
BTC/USD Long-term Trend: Ranging (Daily Chart)
Key levels:
Resistance Levels: $6,800, $7,000, $7,200
Support Levels: $4,000, $3,800, $3,600
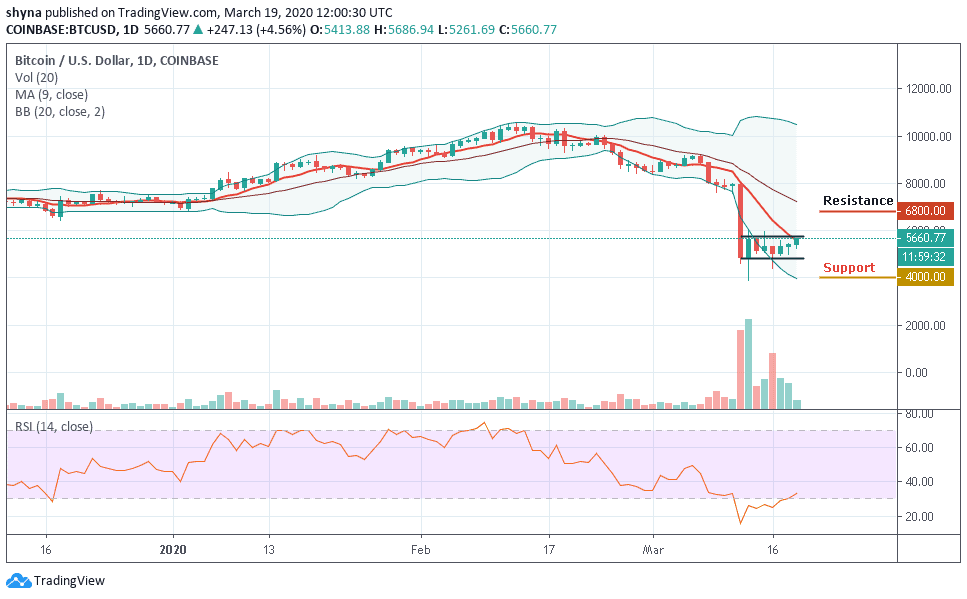
BTC/USD is extending stability for the third day in a row. The movement towards the north may soon a wall at $6,000. The Bitcoin’s recovery has stalled after a move above $5,500 as the market is still full of uncertainty. At the time of writing, BTC/USD is changing hands at $5,660, having gained over 4.5% on a day-to-day basis. On the daily chart, Bitcoin’s recovery is been stopped by the resistance of $5,700 reinforced by the 9-day moving average.
More so, a sustainable move above this handle is needed for the upside to gain traction and take the price towards the critical psychological barrier $6,000. The last time BTC/USD traded above $6,000 was March 12, before the major collapse that wiped billions of dollars from the market. It means that Bitcoin bulls may have a hard time breaking above this level. Meanwhile, on the downside, the initial support is created by the lower limit of the Bollinger bands on approach to $4,000. If it is broken, the sell-off may continue towards the next barrier at $3,800, which is followed by psychological $3,600.
However, we need to consider that the intraday RSI is now moving out of the oversold zone; a period of consolidation around the current levels may still be expected. Meanwhile, the $6,200 and $6,400 levels may further surface as potential resistances should the $6,000 level holds. However, a strong bullish spike might take the price to $6,800, $7,000 and $7,200 resistance levels as the technical indicator RSI (14) faces the north.
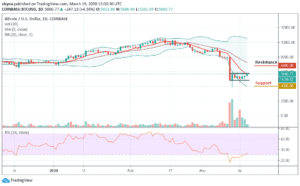
BTC/USD Medium – Term Trend: Bullish (4H Chart)
Following the 4-hour chart, Bitcoin (BTC) bulls have now stepped back into the market pushing the price above its previous support level that existed around $5,600. Although the Bitcoin price has not yet moved above $6,000, it’s still in the loop of making a reversal. Its price hovers around $5,828.59 and may take time to persistently trade above $6,200.

At the moment, BTC/USD is currently moving above the 9-day moving average around the upper limit of the Bollinger bands. More so, as the RSI (14) moves to cross 60-level, the upward movement may likely push the price to the nearest resistance at $6,500, $6,700 and $6,900 levels while the immediate support lies at $5,000, $4,800 and $4,600.
Please note: Insidebitcoins.com is not a financial advisor. Do your research before investing your funds in any financial asset or presented product or event. We are not responsible for your investing results.
Join Our Telegram channel to stay up to date on breaking news coverage