Join Our Telegram channel to stay up to date on breaking news coverage
Bitcoin Price Prediction (BTC) – November 25
Following a bullish momentum for the past weeks, Bitcoin has been attempting to surpass a strong price level.
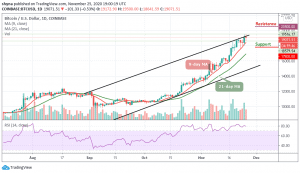
BTC/USD Long-term Trend: Bullish (Daily Chart)
Key levels:
Resistance Levels: $20,500, $20,700 $20,900
Support Levels: $17,800, $17,600, $17,400

Despite the bearish condition, BTC/USD has been following a long-term bullish move since October 7 as the coin hovers around the $19,071 level. However, the daily technical indicator is still trending within the positive level; revealing a bullish momentum. More so, BTC/USD has been trading near $19,500 since yesterday but facing a tough price rejection level; respecting the trend.
What to Expect from Bitcoin (BTC)
Looking at the daily chart, it appears surge volatility could send the price above the upper boundary of the channel; testing the $19,500 level. If BTC/USD fails to surpass the mentioned price rejection level, a possible fall could make a bottom at the $18,000 price level below the 9-day moving average. As it stands now, a strong break up is expected to take the Bitcoin price to the next level as the price may still obey the bulls’ position.
In the opposite direction, if the support level of $18,500 continues to provide support for the market, the Bitcoin price may come back to a resistance level of $19,800 before it experiences a rise above the channel formation to reach the potential resistance levels at $20,500, $20,700, and $20,900 respectively. Presently, BTC/USD is down and there is a high chance for a break than a bounce. The RSI (14) is likely to move out of the overbought region, a further drop may cause the market price to hit the support levels of $17,800, $17,600, and $17,400 respectively.
BTC/USD Medium-Term Trend: Bullish (4H Chart)
Looking at the 4-hour chart, the bears are currently dominating the market as the price is dropping below the 9-day moving average. However, if the price breaks below the lower boundary of the channel, the support levels of $18,000 and below may come into play.
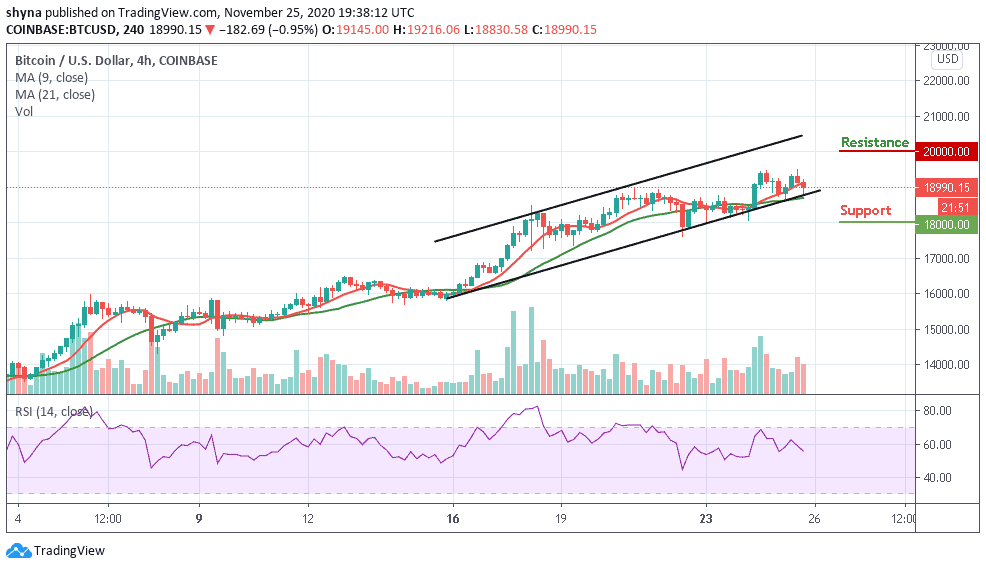
However, as RSI (14) moves below the 55-level, BTC/USD may follow the downside but if it finds its way back to the top, the buyers may likely push the price above the moving averages where it could hit the targeted resistance level of $20,000 and above.
Join Our Telegram channel to stay up to date on breaking news coverage