Join Our Telegram channel to stay up to date on breaking news coverage
Bitcoin (BTC) Price Prediction – October 21
The Bitcoin (BTC) is moving back to its 2020 high adding almost 2.35% gains on the day.
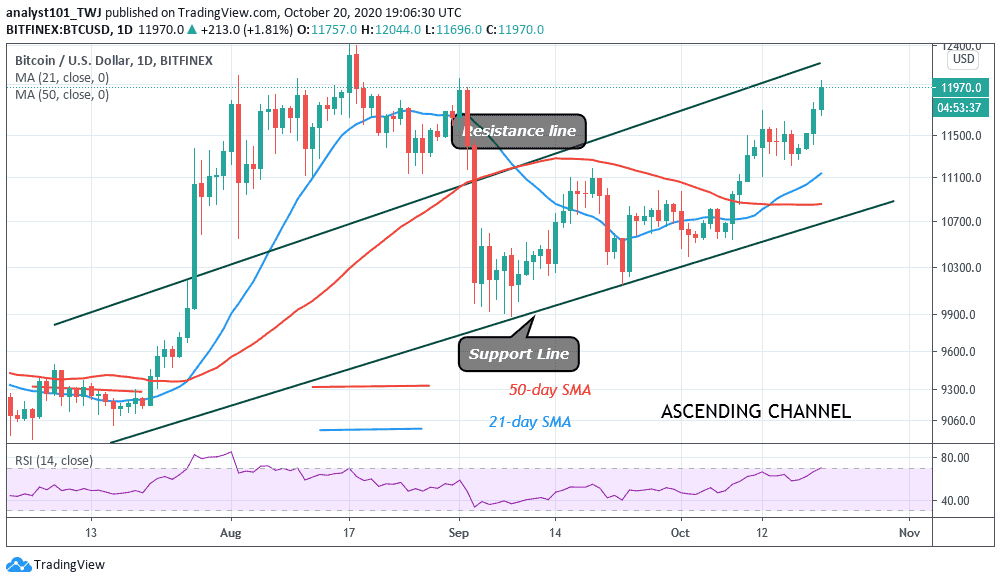
BTC/USD Long-term Trend: Bullish (Daily Chart)
Key levels:
Resistance Levels: $12,800, $13,000, $13,200
Support Levels: $11,500, $11,300, $11,100

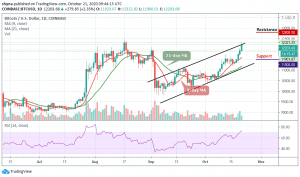
BTC/USD is moving up again, the price action has been able to find strong support at the 9-day moving average. The probability of a bullish trend is now seriously increasing. BTC/USD is testing the higher resistance at $12,330. This is the critical and key level for the bulls. A bullish breakout above this resistance level may likely spark a strong bullish rally in the coming trading sessions.
Where is BTC Price Going Next?
BTC/USD must continue higher for the rally to be recognized. A bull flag chart pattern may be a welcomed pattern and also a bullish cross above the upper boundary of the channel. The question is are we going to see Bitcoin finally cracking $12,800 for good and climbing towards $13,000? However, the interest in the cryptocurrency is quite apparent as many investors are investing millions into the cryptocurrency.
However, the crypto-king has again shown its resilience and surprised the traders pleasantly by sustaining above the $12,000 despite multiple crypto-negative news. More os, any further bullish movement may push the coin towards the resistance level of $12,800, $13,000, and $13,200 respectively. In other words, as the technical indicator moves within the overbought region, a deeper pullback towards $11,700 support may hit the critical supports at $11,500, $11,300, and $11,100.
BTC/USD Medium – Term Trend: Bullish (4H Chart)
The 4-hour chart reveals that the Bitcoin (BTC) is currently trading around $12,262 and far above the 9-day and 21-day moving averages. Meanwhile, we can see that the bullish supply is now becoming heavy in the market as the bulls remain in control.
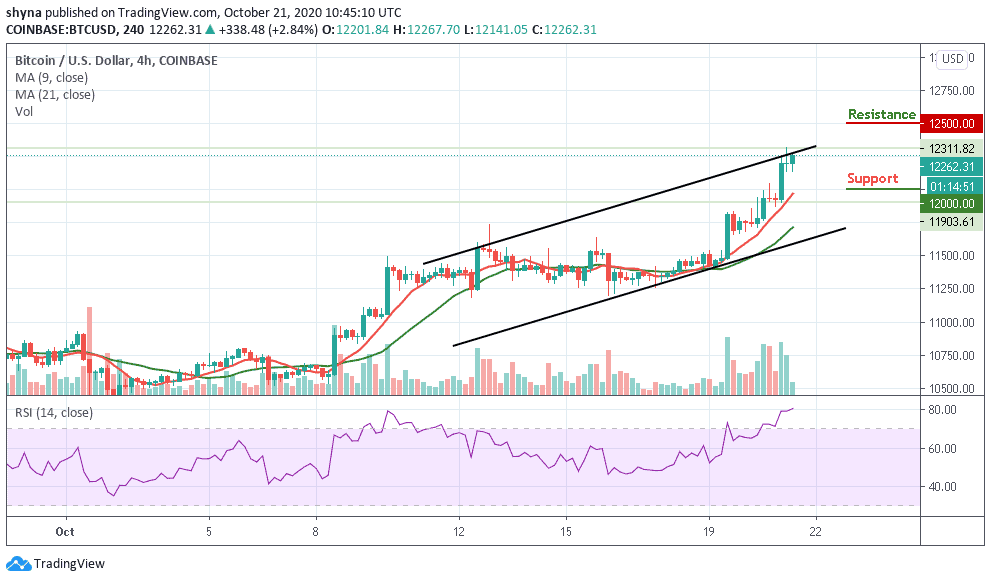
However, if the buyers could strengthen the market more, they can further push the price to a $12,400 resistance level. Therefore, breaking the mentioned resistance could also allow the bulls to test the $12,500 and above. Meanwhile, the RSI (14) is currently within the overbought zone, but any bearish movement may welcome the sellers back into the market which could drag the price back to the support level of $12,000 and below.
Join Our Telegram channel to stay up to date on breaking news coverage