Join Our Telegram channel to stay up to date on breaking news coverage
Bitcoin (BTC) Price Prediction – October 20, 2020
Yesterday, Bitcoin bulls pushed BTC to $11,800 high but were resisted. Today, the bulls break the $11,800 resistance and retested the $12,000 overhead resistance. The retest at the $12000 overhead resistance has made BTC to retrace. Bitcoin has earlier made an initial downward move.
Resistance Levels: $10,000, $11,000, $12,000
Support Levels: $7,000, $6,000, $5,000
Following the retest at the $12, 0000 overhead resistance, BTC/USD has fallen and resumed a downward move. It is currently fluctuating between $11,600 and $12,000 as price tests the resistance zone. On the upside, if the BTC clears the $11,700 to $12,000 resistance zone, the king coin will make a strong move to the $15,000 price levels.
Earlier on the upward move has been made possible because of the holding of the three support zones of $11,100, $11,200, and $11,300 price levels. Today, BTC is trading at $11,970 at the time of writing. This final push to $12,000 overhead resistance was made possible because of the weakness of the US dollar. There has been a correlation between Bitcoin and the U.S. Dollar Currency Index (DXY) which has dropped substantially. Bitcoin tends to rise when the US dollar falls. Perhaps, BTC is likely to break the $12,000 overhead resistance convincingly.
Bitcoin (BTC) Indicator Analysis
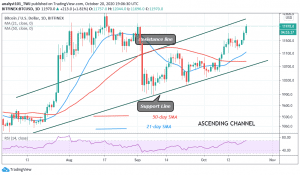
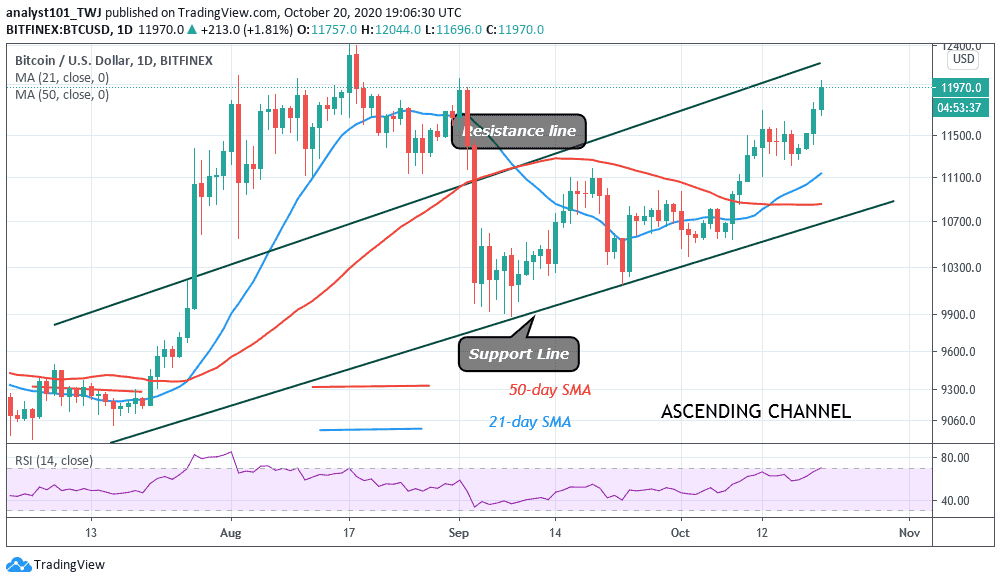
Bitcoin is above level 70 of the RSI period 14 as price approaches the $11,900 and $12,000 resistance. It implies BTC is approaching the overbought region of the market. In the overbought region, sellers may emerge to push BTC price downward. The 21-day SMA and 50-day SMA are sloping northward indicating that BTC is in an uptrend.

Meanwhile, BTC price is retesting the $12,000 overhead resistance but has not fully broken the resistance level. On October 12 uptrend, a retraced candle body tested the 78.6% Fibonacci retracement.level. This suggests that Bitcoin will rise and reach level 1.272 Fibonacci extension or $12,099.0 high.
Join Our Telegram channel to stay up to date on breaking news coverage