

Join Our Telegram channel to stay up to date on breaking news coverage
BCH Price Prediction – October 20
The Bitcoin Cash (BCH) may continue with the downward momentum as it’s been revealed by the technical indicator.
BCH/USD Market
Key Levels:
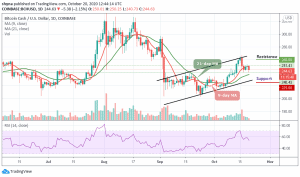
Resistance levels: $260, $270, $280
Support levels: $225, $215, $205

A few days ago, BCH/USD peaked at $266 and has been following a downward trend within the channel. However, for the price not staying above $250 ruins the long-term technical picture of the coin. BCH/USD will have to hold this ground to guide against the further downward pressure as the closest support expects the coin at $240.
What to Expect from Bitcoin Cash (BCH)
At the time of writing the Bitcoin cash is hovering at $244.63 but yet to break below the 21-day MA after broken the 9-day MA. On the upside, a sustained move above $255 will ease the initial downside pressure and create momentum for the bulls with the focus to move the market to the next potential resistance of $260, $270, and $280 respectively.
Furthermore, we realize that the recent consolidation within the ascending channel is necessary for the bullish action. The bulls should be able to hold the market price at $250, if not, crossing below it may cause the downside to continue growing, with the next goal supporting $225, $215, and $205 levels. At the moment, the RSI (14) nosedives below the 50-level, suggesting that the downward momentum may likely continue.
Against Bitcoin, the Bitcoin Cash is currently trading below the 9-day and 21-day moving averages and the daily chart reveals that the bears are now showing a great commitment to the trading. Meanwhile, looking at the recent negative signs, the market price may continue to go down if the sellers continue to pump more pressure into the market.
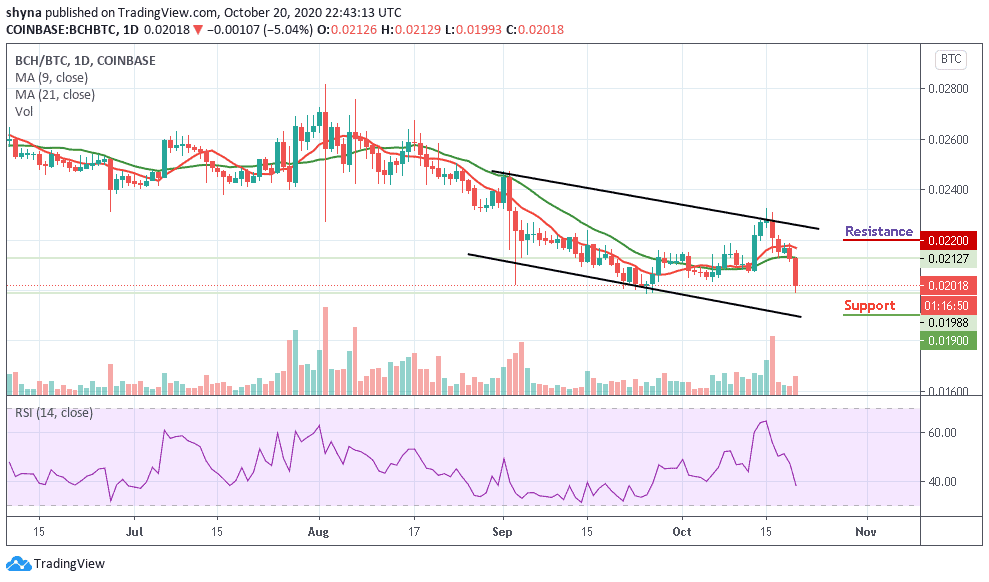
However, as the RSI (14) signal line nosedives below 40-level, if the buyers could successfully hold the support of 0.020 BTC, the market price may likely begin an upward movement, while pushing further above the moving averages may cause it to the resistance level of 0.022 BTC and above but a retest could lower the price to the supports of 0.019 BTC and below.
Join Our Telegram channel to stay up to date on breaking news coverage
