Join Our Telegram channel to stay up to date on breaking news coverage
Bitcoin (BTC) Price Prediction – May 27
The Bitcoin price increased by more than 2.95% today as the cryptocurrency makes its way above $9,000.
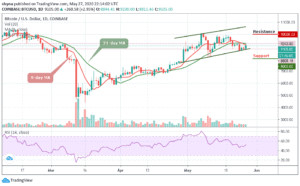
BTC/USD Long-term Trend: Bullish (Daily Chart)
Key levels:
Resistance Levels: $10,000, $10,200, $10,400
Support Levels: $8,000, $7,800, $7,600

BTC/USD is changing hands at $9,105 amid short-term bullish bias with shrinking volatility. Meanwhile, the sustainable move above $9,000 improves the short-term technical picture, though the $9,300 resistance level is still blocking the way and separating the BTC bulls from a sustainable recovery. Similarly, BTC/USD is trading with a gain of over 2.95% in the recent 24 hours.
Furthermore, the way the situation is, the Bitcoin price is coming from a stronger bullish market, although it fails to break above the 9-day and 21-day moving averages. For now, its main aim is to continue nurturing the uptrend, and to do so; the price may need to break above the moving averages.
However, from a different technical perspective, BTC/USD is currently in the hands of the bulls as the technical indicator RSI (14) reveals. The indicator is recovering from the recent downtrend and it’s now settling above 50-level. This shows that bulls are in the driver seat, waiting for a technical breakout.
Therefore, any uptrend above the 9-day and 21-day moving averages can push the price up to resistance levels of $10,000, $10,200, and $10,400 respectively. More so, if the market price breaks below the channel, it could hit the support levels of $8,000, $7,800, and $7,600.
BTC/USD Medium – Term Trend: Bearish (4H Chart)
Looking at the 4-hour chart, BTC/USD is trading sideways, the market has been showing a sign of bullish trend since the early hours of the trading. However, the intraday trading is still looking bullish; following the recent rebound at $9,000 which is now a key support level while the next key support levels lie at $8,800, $8,600, and $8,400.
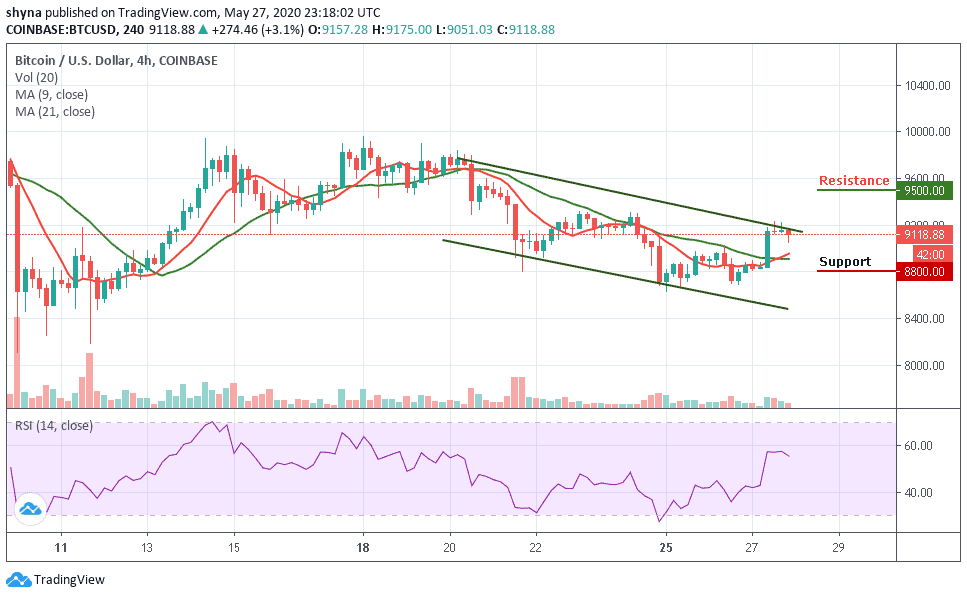
However, should the bulls push the market price above the channel, traders may likely experience a retest of $9,300 resistance level, breaking this level may further take the coin to reach the resistance level of $9,500 and above. Currently, the technical indicator RSI (14) is seen moving in the same direction, suggesting a sideways movement.
Please note: Insidebitcoins.com is not a financial advisor. Do your research before investing your funds in any financial asset or presented product or event. We are not responsible for your investing results.
Join Our Telegram channel to stay up to date on breaking news coverage