Join Our Telegram channel to stay up to date on breaking news coverage
Bitcoin (BTC) Price Prediction – December 16
Bitcoin price is struggling to recover above $7,100 against the USD but the coin remains at a risk of a larger breakdown below the $7,000 support.
BTC/USD Long-term Trend: Bearish (Daily Chart)
Key levels:
Resistance Levels: $7,800, $8,000, $8,200
Support Levels: $6,500, $6, 300, $6,100

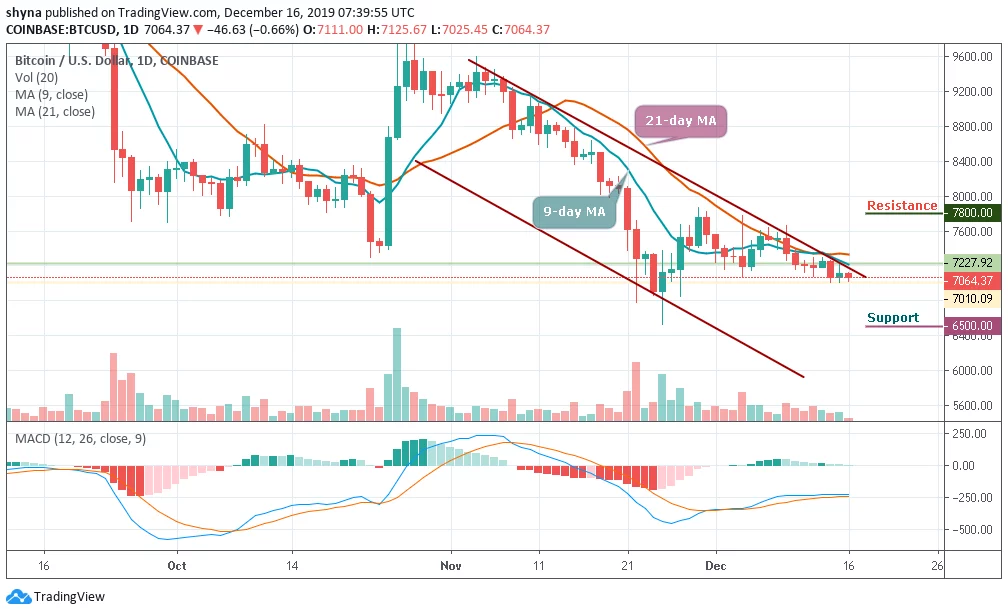
BTC/USD bulls are intentional about finding higher support for Bitcoin. This battle comes after the coin tried and failed to extend gains past $7,227 which happened to be the daily high yesterday. The Bitcoin price is back under $7,100 and currently changing hands at $7,064. In this same manner, the price of Bitcoin moves below the 21-Day and the 9-Day moving averages within the descending channel.
However, an upside break above the 21-day MA around $7,340 is a must to start a substantial recovery. Meanwhile, the next hurdles may be seen near the resistance levels of $7,800, $8,000 and $8,200. On the downside, initial support is near the $7,050 level and if there is a successful break below the support level of $7,000, the bears are likely to gain strength by bringing the price to a low of $6,500, $6,300 and $6,100 respectively.
Currently, Bitcoin price follows a dominant bearish bias and a glance at the Moving Average Convergence Divergence (MACD) displays a negative picture for BTC in the near-term. In addition, maintaining a gradual downward trend in the negative region, the MACD divergence decreases as a signal for an increase in selling entries.
BTC/USD Medium – Term Trend: Ranging (4H Chart)
Yesterday, the Bitcoin price surged upwards of over $160 within 24 hours, catapulting its price from $7,042 to reach around $7,217. After the sudden rise, the coin started dropping in price to where it’s trading currently at $7,053. Should the price continue to drop further, it could reach the nearest supports at $6,900, $6,750 and $6,800 respectively.
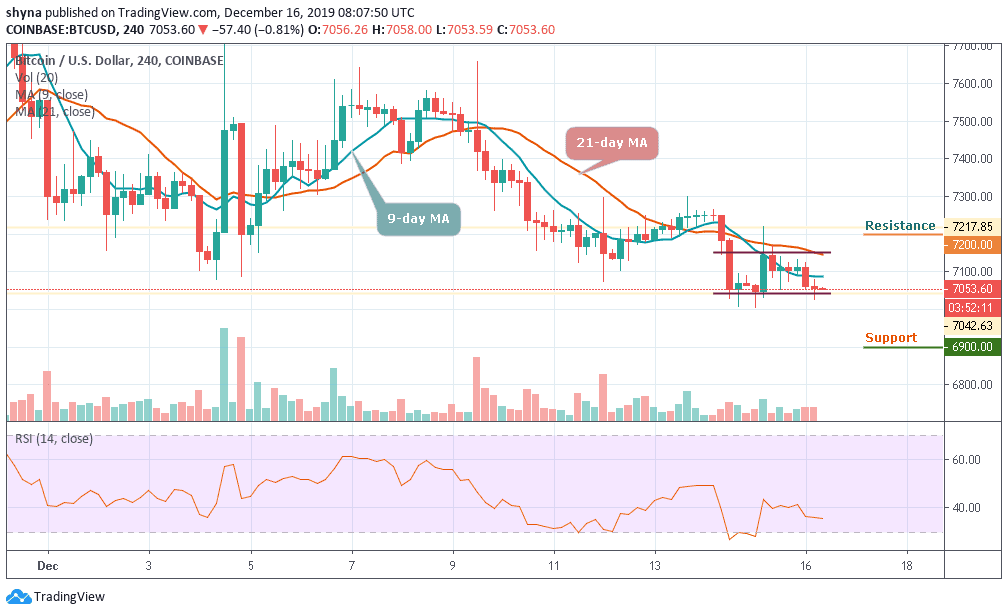
Moreover, if the bulls push the coin above the blue-line of the 9-day MA and the orange-line of 21-day MA, the price of Bitcoin may likely touch the potential resistance levels of $7,200, $7,300 and $7,400. Presently, the market is indecisive as the RSI (14) indicator moves below the 40-level.
Please note: Insidebitcoins.com is not a financial advisor. Do your research before investing your funds in any financial asset or presented product or event. We are not responsible for your investing results.
Join Our Telegram channel to stay up to date on breaking news coverage