Join Our Telegram channel to stay up to date on breaking news coverage
Bitcoin (BTC) Price Prediction – August 1
The Bitcoin price is in the hands of the buyers as confidence in the bullish market mounts.
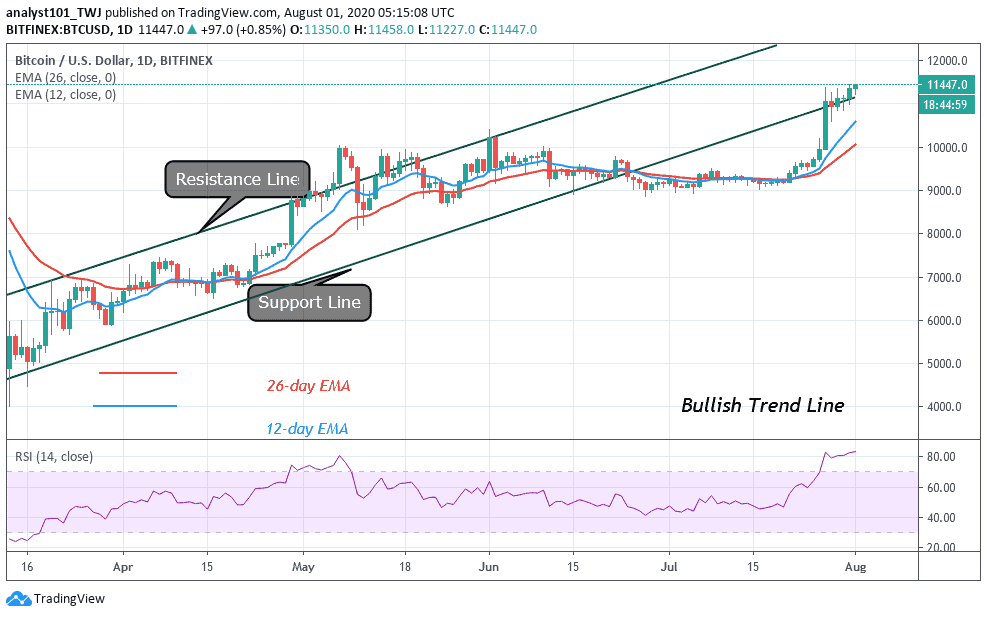
BTC/USD Long-term Trend: Bullish (Daily Chart)
Key levels:
Resistance Levels: $12,700, $12,900, $13,100
Support Levels: $10,800, $10,600, $10,400
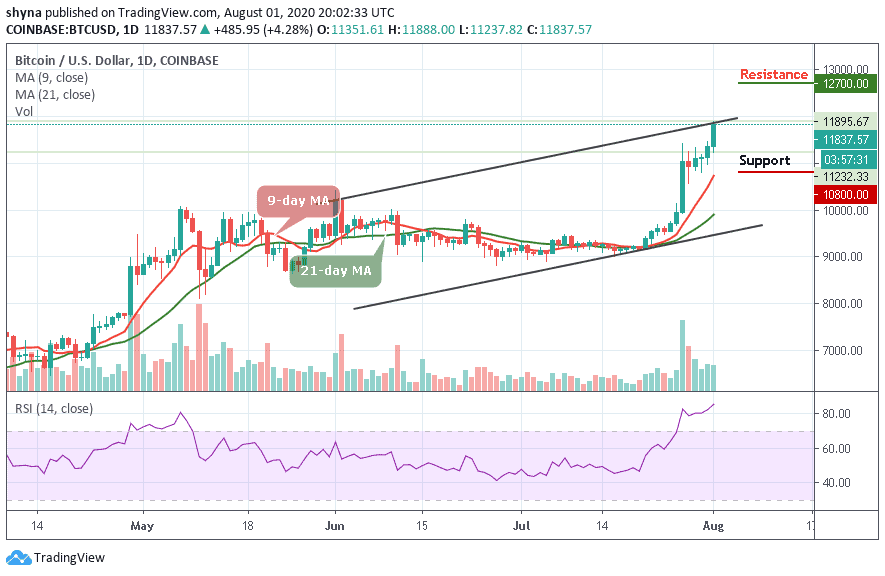
Today, BTC/USD is making a surprising move as the coin touches the daily high of $11,895; this is a monthly close higher than yesterday which happened to be the close of the month. Looking at the past daily charts, we can clearly see that the current bullish movements started upon breaking the resistance level of $9,200 on July 21, and most importantly, was breaking above the 9-day and 21-day moving averages.
However, as the technical indicator RSI (14) remains in the overbought condition, the Bitcoin price is currently surpassing a critical ascending trend-line together with the horizontal resistance at $11,837. Any further bullish movement above it may fuel the continuation towards $12,000 and the psychological level of $12,500.
Further above lies $12,700, the latter is followed by the $12,900 and $13,100 resistance levels. Meanwhile, in case of a correction, the latest resistance levels could serve as support. The first level from below is $11,500, followed by $11,000. Further below lies at $10,800, $10,600, and $10,800.
BTC/USD Medium-Term Trend: Bullish (4H Chart)
On the 4-hour chart, BTC/USD touches a high of $11,873 after the price breaks above the upper boundary of the channel. However, as the technical indicator RSI (14) moves at 77-level within the overbought, the upward move may be facing the resistance above the recent high.
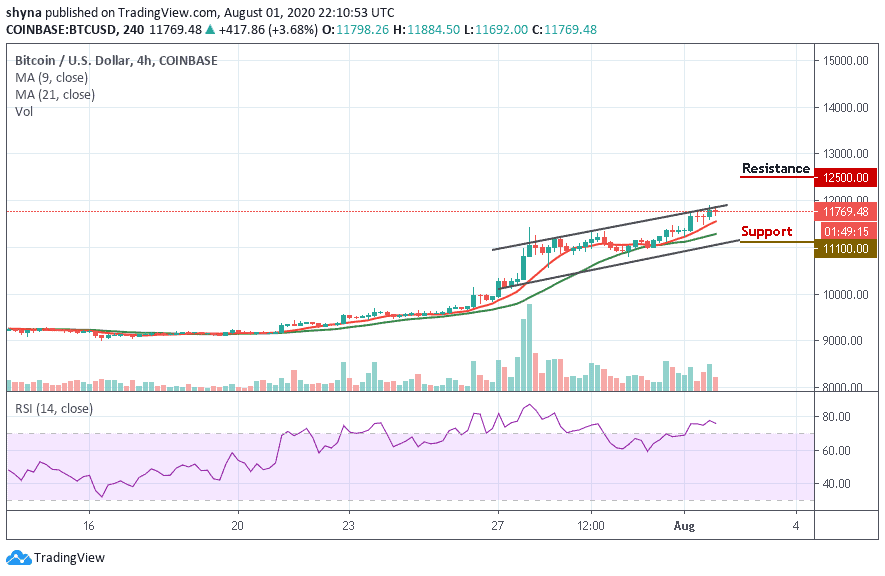
Meanwhile, on the downside, if the market price retraces and breaks below the 9-day and 21-day moving averages within the ascending channel, the coin may further depreciate to the support of $11,100 and below. In other words, if the price retraces and finds another resistance above the channel, the uptrend could resume into the previous highs to hit the resistance at $12,500 and above.
What Is the Next Direction for Bitcoin?
According to the trading charts, the technical indicator confirms the bullish opinion of the above analysis in the very short term. However, traders should be careful of excessive bullish movements. Therefore, it is appropriate for investors to continue to watch any excessive bullish movements which might lead to a small bearish correction in the nearest term.
Join Our Telegram channel to stay up to date on breaking news coverage