Join Our Telegram channel to stay up to date on breaking news coverage
Bitcoin (BTC) Price Prediction – August 1, 2020
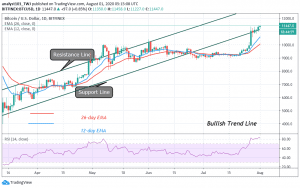
Today, BTC/USD is now trading above $11,400 after days of battle against the resistance at $11,200. The king coin is close to its next target price of $11,500. This is a positive sign as buyers continue to exercise dominance over sellers.
Resistance Levels: $10,000, $11, 000, $12,000
Support Levels: $7,000, $6,000, $5,000
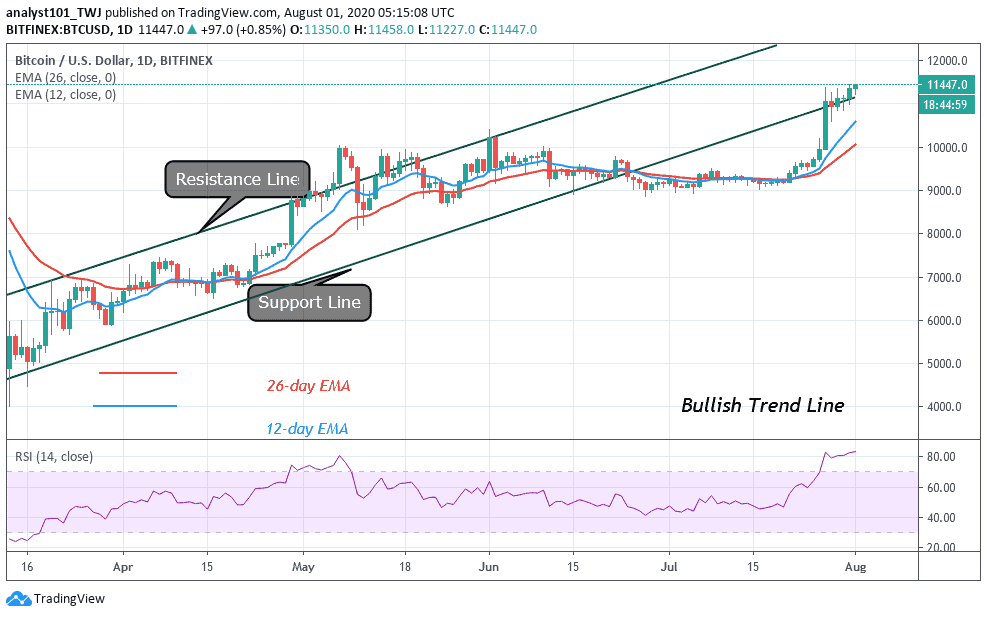
Since July 27, the bulls have been having a running battle to push BTC above the $11,200 resistance. Buyers have retested the resistance on four different occasions without success. Yesterday, they were able to push above the $11,200 resistance as the market moves up. Today, the market has risen above $11,400 after several retests. Nevertheless, these retests could have led to a breakout above $11,400.
Analysts believe that the market will reach a high of $12,000. Conversely, if the market retraces and breaks below $11,000, BTC will drop to $10.250. Nevertheless, Bitcoin has chances of a further upward move as price breaks above the support line of the ascending channel. The market is rising as BTC is at level 83 of the Relative Strength Period 14. The coin is trending in the bullish trend zone.
BTC/USD Medium-term Trend: Bullish (4-Hour Chart)
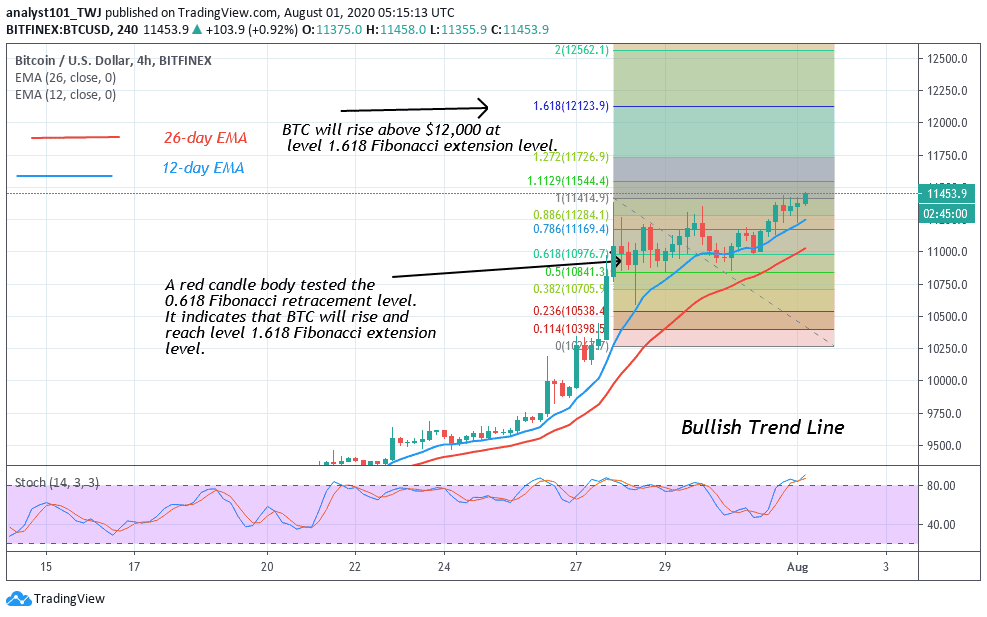
On the 4 hour chart, Bitcoin is consolidating above $11,000 before the resumption of the uptrend. On July 27, there was a price spike that reached a high of $11,379 but price pulled back and resumed consolidation. A candle body tested the 0.618 Fibonacci retracement level. It indicates that BTC will rise and reach the level at 1.618 Fibonacci extension level. In other words, as the market resumed uptrend, BTC will reach a high of $12,125 as indicated on the chart. Today, BTC is in a bullish momentum as it is above 80% range of the stochastic indicator.
Join Our Telegram channel to stay up to date on breaking news coverage