Join Our Telegram channel to stay up to date on breaking news coverage
Bitcoin (BTC) Price Prediction – May 21, 2020
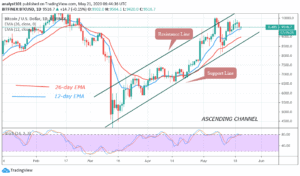
Yesterday, BTC/USD pair turned down after testing the $9,842 resistance zone. The market dropped to $9,301 low. There was an upward correction to $9,600 but the selling pressure is resuming at the time of writing. In the past week when BTC retraces to $9,300 low, the bullish movement will resume retesting the overhead resistance.
Key Levels:
Resistance Levels: $10,000, $11, 000, $12,000
Support Levels: $7,000, $6,000, $5,000
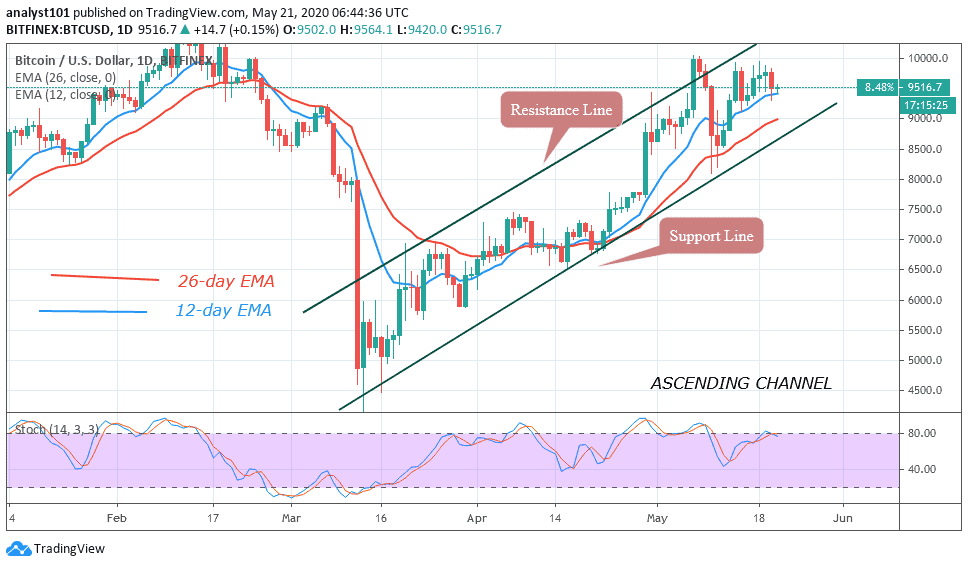
In the last three days, Bitcoin has been hovering above $9,700 as bulls and bears were undecided about the direction of the market. The indecision has been resolved as price dropped to $9,400. Previously, in the upside range of $9,300 to $10,000, the bulls will buy the dips to resume uptrend and retest the $10,000 resistance. This is the market scenario when price retraces from the overhead resistance after a retest.
Today, we are going to watch if the upside range is going to continue. If it does continue, the bulls will purchase the dip as the market moves back to the $10,000 resistance zone. However, if the bears sink price below $9,400 support, the market is likely to drop to $9,100 low. Bitcoin will drop to $8,200 low if the $9,100 support cracks. Meanwhile, BTC is in the overbought region but below the 80 % range of the daily stochastic. This indicates that the king coin may have a downward move as sellers emerge in the overbought region.
BTC/USD Medium-term Trend: Bullish (4-Hour Chart)
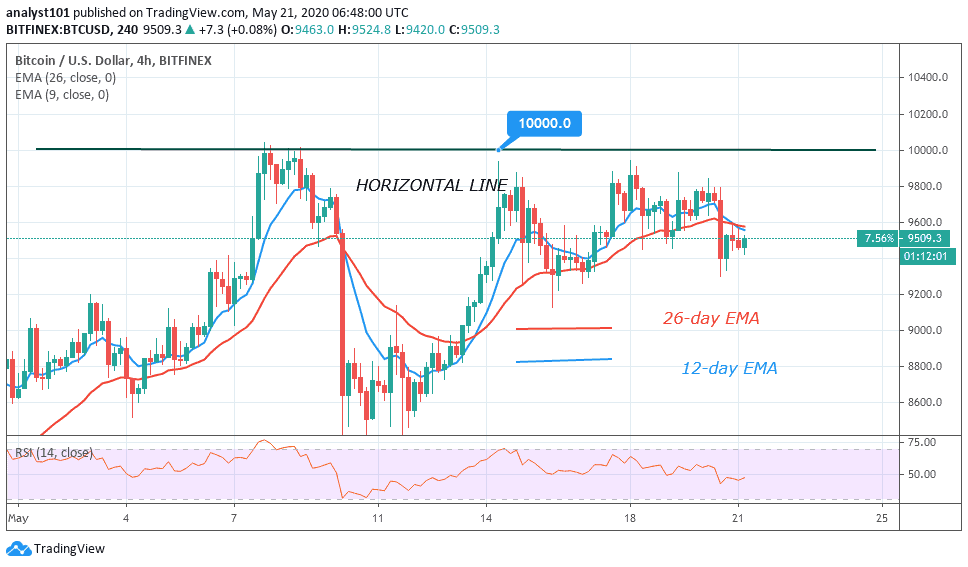
On the 4 hour chart, Bitcoin was consolidating above $9,700, before the breakdown yesterday. The crypto drops to $9,301 and presently fluctuating about $9,400. The price has broken below 12-day EMA and the 26-day EMA which indicates further selling pressure on the coin. At the moment, the coin has fallen to level 45 of the Relative Strength Index period 14. It indicates that it is in the downtrend zone and below the centerline 50.
Please note: Insidebitcoins.com is not a financial advisor. Do your research before investing your funds in any financial asset or presented product or event. We are not responsible for your investing results.
Join Our Telegram channel to stay up to date on breaking news coverage