Join Our Telegram channel to stay up to date on breaking news coverage
Bitcoin (BTC) Price Prediction – June 28, 2020
After the recent breakdown on June 26, BTC/USD slumped to $9,011 low and abruptly corrected upward to retest the $9,300 resistance. BTC dropped again to $9,100 and resumed consolidation between $9,100 and $9,200. The bulls failed to hold the $9,100 and $9,200 support for the first time in June.
Key Levels:
Resistance Levels: $10,000, $11, 000, $12,000
Support Levels: $7,000, $6,000, $5,000
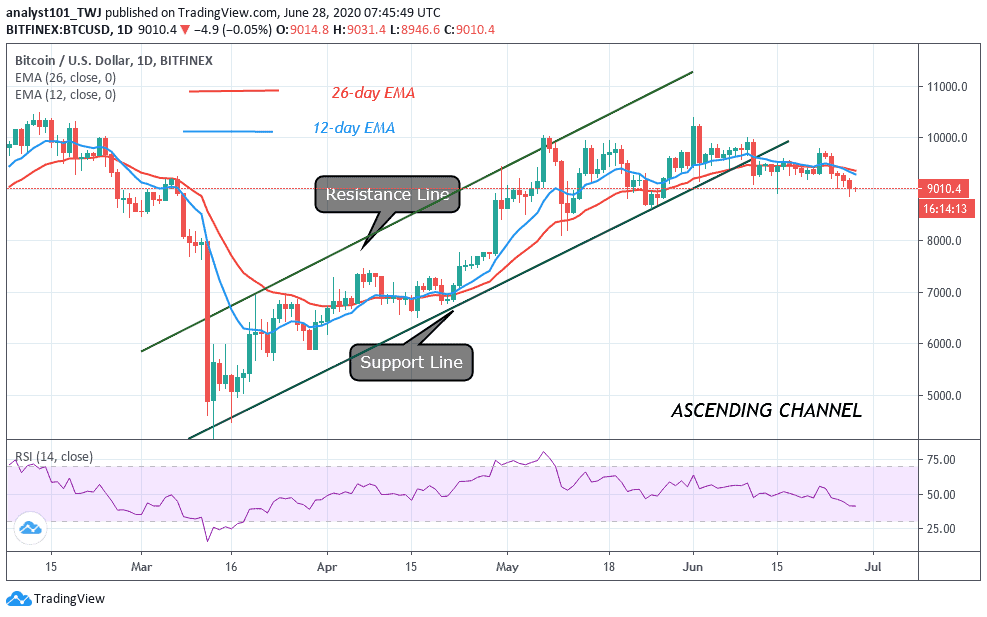
Yesterday, the bears succeeded in breaking the $9,000 as Bitcoin fell to $8,855 low. The price corrected upward and resumed fluctuation above $8,900 in the last 24 hours. As price fluctuates it faces initial resistance at $9,000 and $9,040. On the upside, if the bulls break the resistance at $9,000 or $9,040, BTC will rise and regain the previous price levels. In other words, BTC will reach the $9,300 support where the upside range trading will commence.
However, if the king coin falls and reaches the $8,800 low, a rebound is likely to occur to push BTC above $9,000 region. Conversely, if Bitcoin falls to $8,800 low and the downtrend persists, a larger decline is likely to occur. The bearish momentum will extend to $8,500 Low. The bulls may strongly defend the support at $8,100 if the bearish run persists. In the meantime, Bitcoin is still fluctuating above $8,900 at the time of writing. The crypto is at level 41 of the Relative Strength Period 14. It indicates that the market is still in the downtrend zone and likely to fall.
BTC/USD Medium-term Trend: Bullish (4-Hour Chart)
On the 4 hour chart, the $9,000 support was broken but the breakdown is not sufficient for a larger decline. Before now, the bulls were struggling to push BTC above $9,700. After two unsuccessful attempts, the market drops to $9,200.
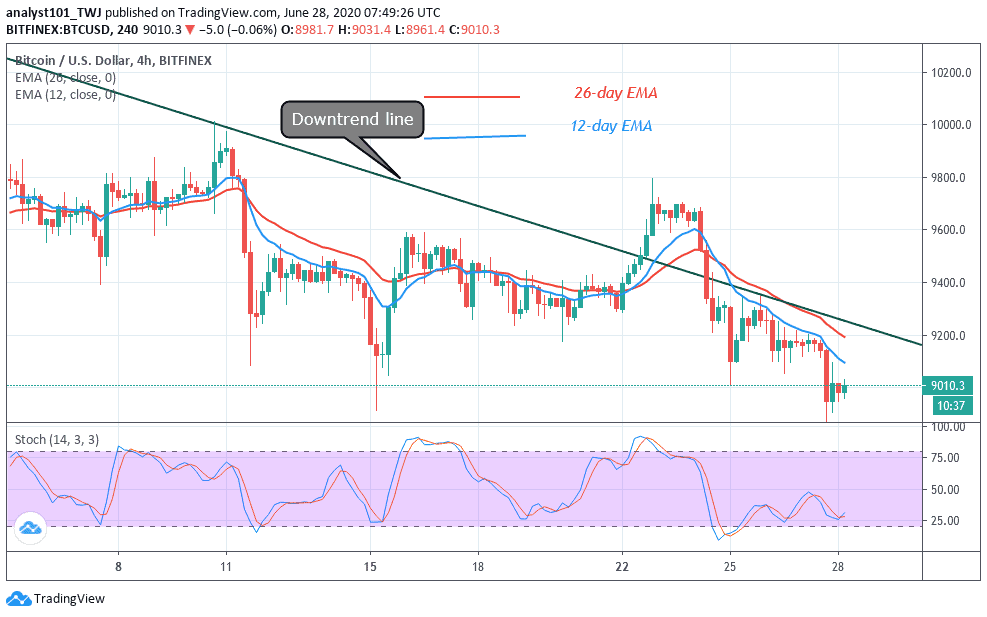
Later, after an initial correction, the price fell to $9,011 low. The bulls reacted and attempted to push BTC above $9,300. Consequently, the downtrend resumed as bulls failed to break the $9,300 resistance. The bearish momentum broke the $9,000 – $9,200 support. Today, the coin has fallen to $8,900 low and it is fluctuating above the current support. Meanwhile, BTC is below a 25% range of the daily stochastic. Presently, it is in a bearish momentum but the price action is indicating a sideways move.
Join Our Telegram channel to stay up to date on breaking news coverage