

Join Our Telegram channel to stay up to date on breaking news coverage
Bitcoin (BTC) Price Prediction – June 13, 2020
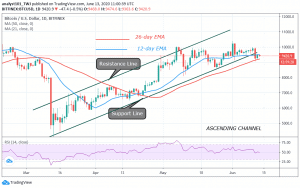
On June 11, BTC/USD pair crashed to $9,084 low after retesting the $10,000 overhead resistance. Similarly, BTC plunged to $9,150 low after reaching a high of $10,400. This clearly explains the presence of bears aggressively defending the $10,500 resistance zone.
Key Levels:
Resistance Levels: $10,000, $11, 000, $12,000
Support Levels: $7,000, $6,000, $5,000

Fortunately, from the two separate scenarios, Bitcoin recovered immediately after the breakdowns. Price corrected upward as Bitcoin resumed the upside range trading. The upside range trading has been very functional in May. The bulls have the opportunity of retesting the overhead resistance; though unable to breach it. Today, the king coin is consolidating above $9,400 for an upward move to the previous highs. It is a fact that once price stabilizes above $9, 300, it is an indication of the resumption of the upside range.
In the upside range, Bitcoin fluctuates between $9,300 and $9,800 to retest the $10,000 overhead resistance. However, it must break the $9,800 or $9,880 resistance before having access to the overhead resistance. In the meantime, BTC is struggling below $9,600 resistance. Nonetheless, the breakdown to $9,084 was interrupted because of strong buying pressure above $9,000 support. Bitcoin would have resumed a downward move if the selling pressure persists. The Relative Strength Index period 14 is at level 49 indicating that price is in the downtrend zone. BTC tends to fall because it is below the centerline 50.
BTC/USD Medium-term Trend: Bullish (4-Hour Chart)
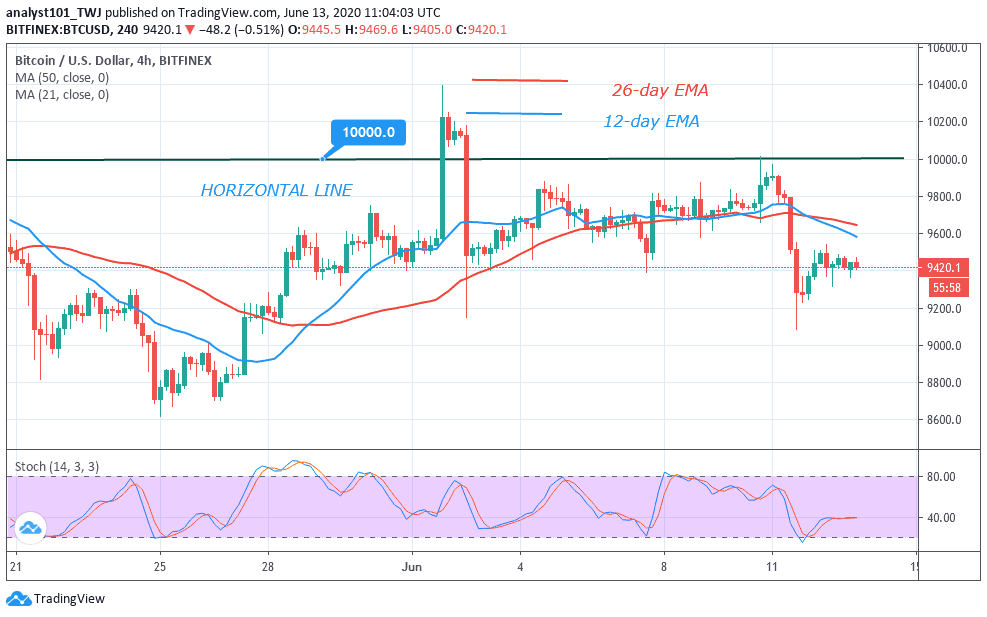
On the 4 hour chart, in June, we have recorded two incidences of breakdown after buyers break or retest the overhead resistance. In the breakdowns, buyers make immediate recoveries in the $9,000 or $8,000 region. This is because of the strong buying pressures in these regions. On June 11, BTC was oversold as it fell below a 30 % range of the daily stochastic. Buyers emerged to push prices upward.The market is now in a bullish momentum.
Please note: Insidebitcoins.com is not a financial advisor. Do your research before investing your funds in any financial asset or presented product or event. We are not responsible for your investing results.
Join Our Telegram channel to stay up to date on breaking news coverage
