

Join Our Telegram channel to stay up to date on breaking news coverage
Bitcoin (BTC) Price Prediction – June 21, 2020
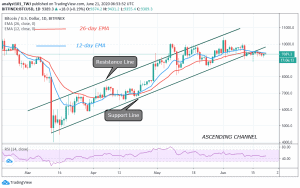
BTC/USD pair trades in the upside range because the $9,000-$9,300 support holds. In the $9,000 region, BTC fluctuates between $9,300- $9,800 for the upside range trading. Therefore, we should expect a retest of the $10,000 overhead resistance.
Key Levels:
Resistance Levels: $10,000, $11, 000, $12,000
Support Levels: $7,000, $6,000, $5,000

As the $9,000- $9,300 supports holds, the next move for Bitcoin will be at the $9,600 resistance. When the bulls clear this resistance, the market will move to retest the $9,800 and $9,880 resistances. The breaking of these levels will not be an easy task as the bears will strongly defend the resistance zones. Assuming the bulls fail to break the $9,800 resistance, BTC will retrace to $9,400 and resume a fresh uptrend. Nonetheless, since the $9,600 and $9,800 resistances have been tested several times, this will lead us to break out on the upside.
When the bulls break the $9,600 and $9,800 resistances, price will accelerate to retest the $10,000 overhead resistance. A breakout on the upside is expected as bulls have tested the resistance on several occasions. Conversely, if the $9,000- $9,200 support fails to hold, BTC will drop sharply to $8,500 low or $8,200 low. When BTC drops sharply, it is because it has been tested several times. Meanwhile, the market is still consolidating above $9,300. The Relative Strength Index period 14 is at level 47. The coin is still in the downtrend zone.
BTC/USD Medium-term Trend: Bullish (4-Hour Chart)
On the 4 hour chart, BTC was still consolidating above $9,300 support but the market dropped to $9,269.70. The support is holding as BTC makes an upward move.
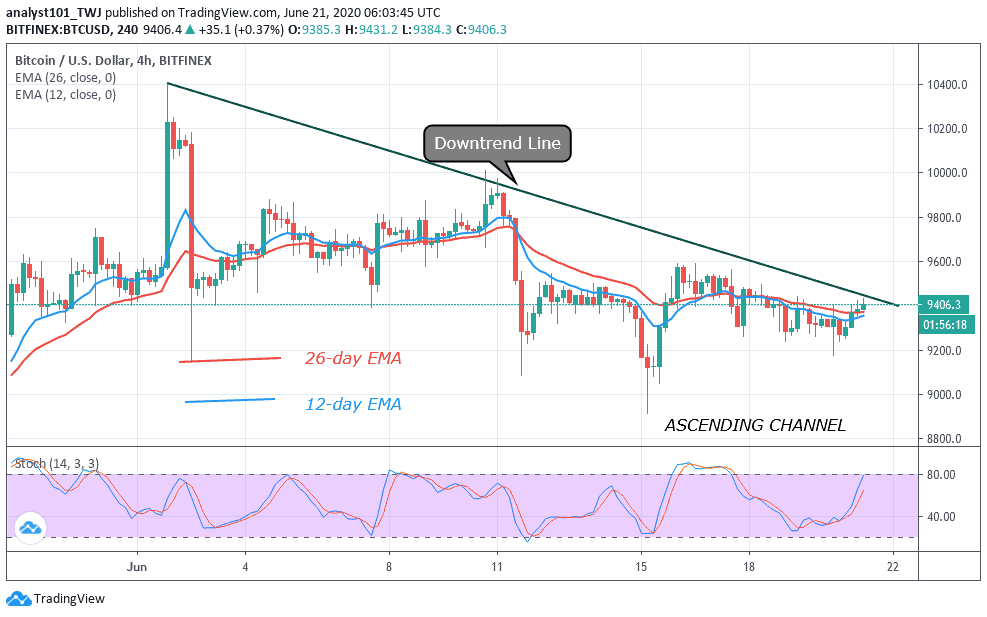
The price has broken above the EMAs. This is an indication that the market has reached the bullish trend zone. On the upside, if price breaks and closes above the downtrend line, Bitcoin will resume its uptrend. Bitcoin is above 40% range of the daily stochastic. Presently, it is in a bullish momentum. This has been confirmed as price action indicates a bullish signal.
Join Our Telegram channel to stay up to date on breaking news coverage
