Join Our Telegram channel to stay up to date on breaking news coverage
Bitcoin (BTC) Price Prediction – June 11, 2020
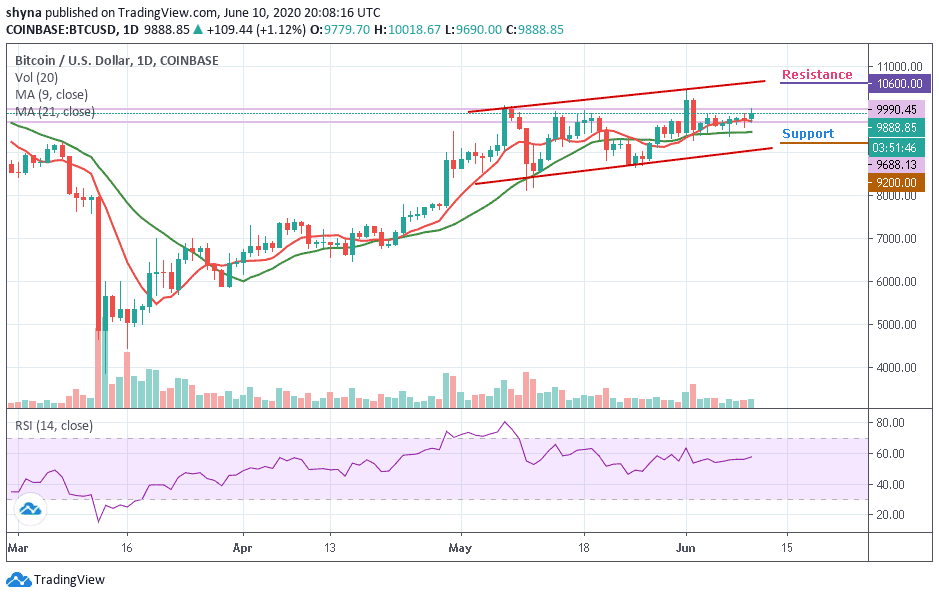
About 24 hours ago, there was a price spike as bulls retested the $10,000 overhead resistance. Also,there was immediate rejection as BTC/USD pair consolidates above $9,800 near the overhead resistance. This is a positive move as consolidation beneath a resistance usually sparks off breakout during a bullish trend.
Key Levels:
Resistance Levels: $10,000, $11, 000, $12,000
Support Levels: $7,000, $6,000, $5,000
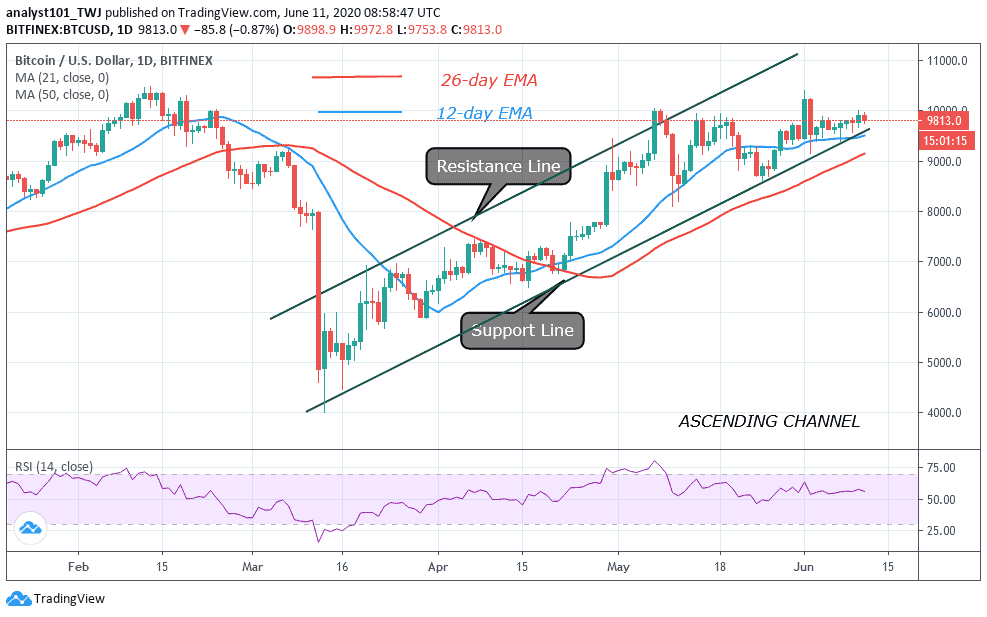
Throughout last week, Bitcoin has been trading marginally in the region of $9,700. Before now BTC has rallied to $10,400 high. After the bullish impulse, it faces another rejection that plunged the coin to $8,150 low. The price corrected upward but BTC was restricted below $9,800 resistance. Yesterday, the upside range took a new dimension as bulls retested the $10,000 overhead resistance. Today, buyers have retested the resistance zone while it continues its consolidation.Presently, price is consolidating in the region of $9,800 below the $10,000 resistance. On the upside, a rebound above $9,800 or breakout will propel price to break through the resistance.
Bitcoin will rally above $10,500 if price rebounds above the current support. The king coin will pick up momentum and resume the uptrend to $11,000 price level. Conversely, this bullish view will be invalidated if the bears turn around and break below $9,800 support. BTC will drop to $9,600 and $9,400. Nevertheless, if the bears break the $9,400 support, the upside range may fail to hold. We should begin to see a downward movement of prices. The Relative Strength Index period 14 is at level 57 indicating that price is in the uptrend zone.
BTC/USD Medium-term Trend: Bullish (4-Hour Chart)

On the 4 hour chart, BTC has moved up to $9,800 support to resume consolidation below the overhead resistance. Price is fluctuating above $9,800 to retest the resistance. On the upside, if the bulls sustain price above $9,800, BTC will rally above the overhead resistance. However, there is rejection and BTC is falling after the second retest. Meanwhile, BTC is below 60% range of the daily stochastic indicating a bearish momentum.
Please note: Insidebitcoins.com is not a financial advisor. Do your research before investing your funds in any financial asset or presented product or event. We are not responsible for your investing results.
Join Our Telegram channel to stay up to date on breaking news coverage