Join Our Telegram channel to stay up to date on breaking news coverage
Bitcoin (BTC) Price Prediction – June 10
BTC/USD is up by more than 1.12% as the price struck a sudden and bullish price spike.
BTC/USD Long-term Trend: Bullish (Daily Chart)
Key levels:
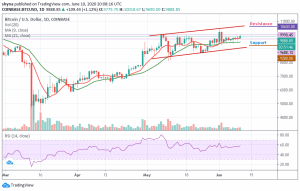
Resistance Levels: $10,600, $10,800, $11,000
Support Levels: $9,200, $9,000, $8,800
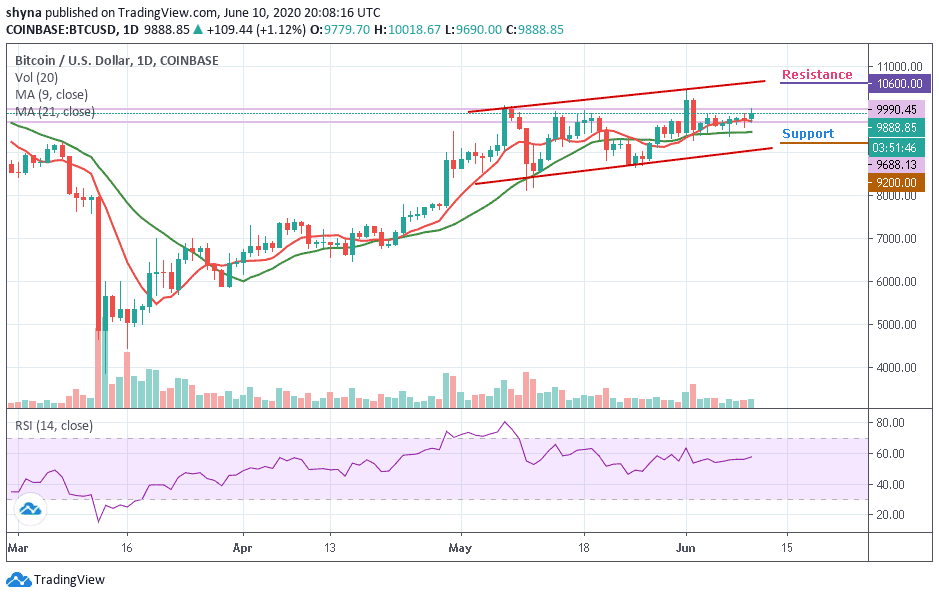
BTC/USD is seen pushing the price above the critical resistance level as the coin is moving above $9,800 to trade at $9,888.85 at the time of writing. The king coin is moving with a bullish momentum after a sustainable break above an important technical level.
However, the return above $9,800 could set the framework for gains towards $10,000. Meanwhile, the technical analysis shows that the bulls are ready for action especially when the up-trending RSI (14) is considered. Any further bullish movement above the 9-day and 21-day moving averages could pave the way for the gains above $10,200. Other resistance levels to watch include $10,600, $10,800 and 11,000.
On the downside, if the price falls back below $9,600 level and moves to cross below the moving averages, the bears may wrestle out the control over the situation very quickly. This may likely serve as a major blow for the market sentiments as traders could interpret it as a sign of underlying weakness. The next important support comes at $9,400, which is followed by $9,200, $9,000, and $8,800 support levels.
BTC/USD Medium – Term Trend: Bullish (4H Chart)
The 4-hour chart reveals that the Bitcoin price surged upwards within 24 hours, catapulting its price over $9,700 to reach where it currently trades at around $9,895. This sudden rise also pushed the price overall other altcoins, which increased by more than 1.19% in the respective period. However, the closest resistance levels lie at $10,100 and $10,300, while the nearest supports are $9,700 and $9,500 respectively.
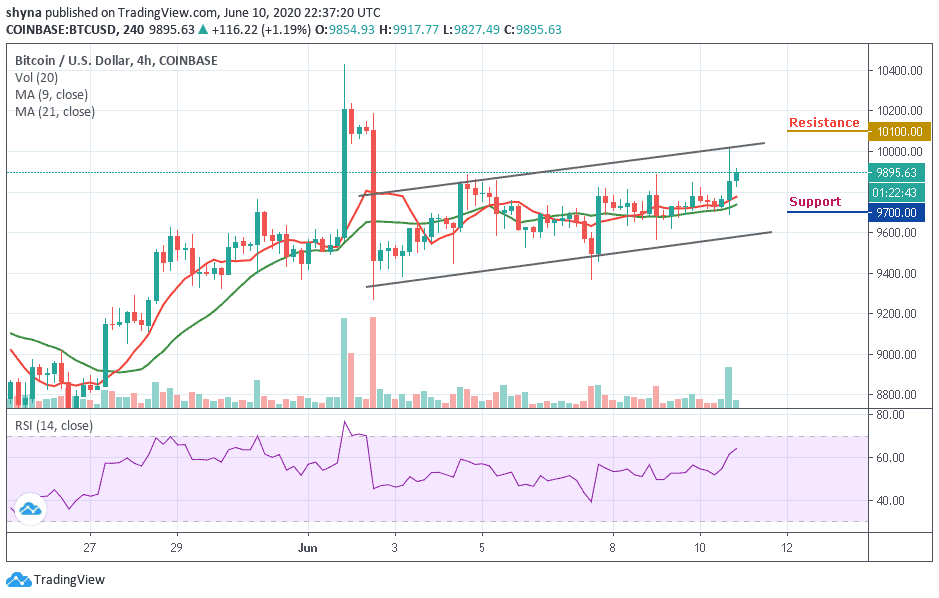
Moreover, as the coin moves above the 9-day and 21-day moving averages, the technical indicator is looking bullish and still flashing buy signals. After recording its lowest since early this month, the RSI (14) indicator is moving towards the 65-level, which indicates a bullish movement at the moment.
Please note: Insidebitcoins.com is not a financial advisor. Do your research before investing your funds in any financial asset or presented product or event. We are not responsible for your investing results.
Join Our Telegram channel to stay up to date on breaking news coverage