Join Our Telegram channel to stay up to date on breaking news coverage
Bitcoin (BTC) Price Prediction – April 20
The Bitcoin price is moving within consolidation sitting just above the big $7,000 price mark.
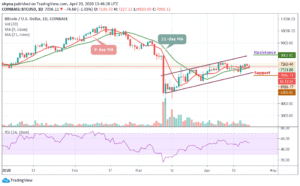
BTC/USD Long-term Trend: Bullish (Daily Chart)
Key levels:
Resistance Levels: $8,000, $9,800, $10,000
Support Levels: $7,500, $7,300, $7,100

After facing rejection at $7,260, BTC/USD price dived below $7,131 to touch $6,926 level. At the moment, the Bitcoin price is currently consolidating around $7,056, with a few bearish signals. However, the recent correction to the upward failed near the $7,260.44 level. It seems like Bitcoin bulls are struggling to gain momentum above the $7,300 level.
At the same time, the Bitcoin price is trading within the limits of an ascending channel. While the channel resistance is a barrier to bullish advancement, the support continues to be critical to the Bitcoin recovery process. As long as the channel support stays intact, Bitcoin bulls could have the opportunity to focus on higher levels, especially the resistance levels of $8,000, $8,200 and $8,400.
Looking at it technically, Bitcoin is slightly in the hands of the bulls. More so, the technical indicator formally shows that a sideways action is likely to take precedence in the market soon. Consequently, a break above the short term resistance at $7,100 could boost Bitcoin towards $7,200 which is the next hurdle. As far as support areas are concerned, Bitcoin price reversal may find support $6,800.
According to the technical indicator RSI (14), if the signal line move below 52-level, BTC/USD may likely touch the critical supports at $6,300, $6,100 and $5,900 respectively.
BTC/USD Medium – Term Trend: Ranging (4H Chart)
Concerning the 4-hour chart, at the opening of the market today, BTC/USD first went up and touched $7,224.45 but has dropped slightly below the 9-day and 21-day moving averages within 24 hours, bringing its price from $7,224 to reach around $6,922. If the price continues to drop further and move below the channel, it could reach the nearest supports at $6,700 and below.
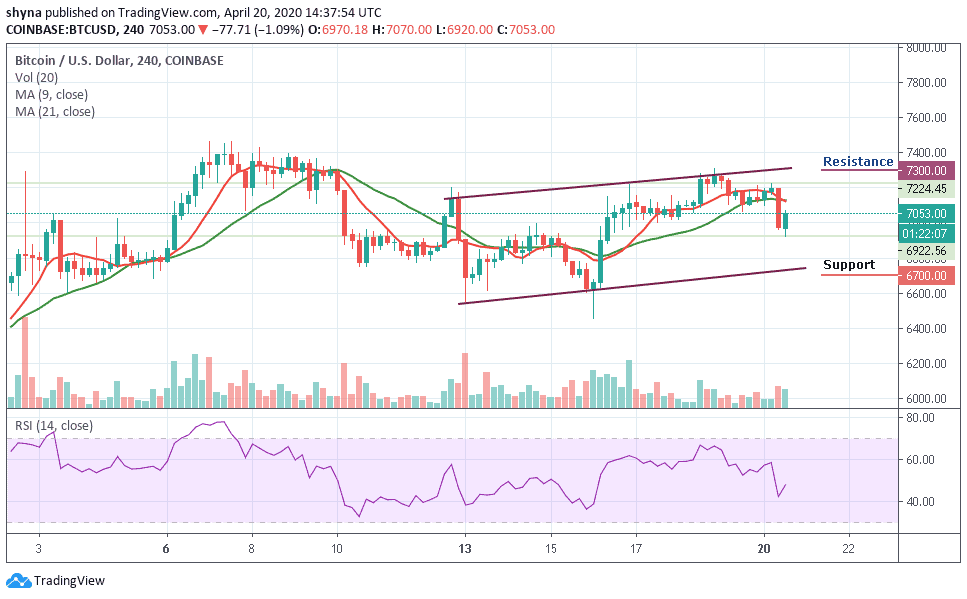
In other words, if the bulls push the coin above the 9-day and 21-day moving averages, the price of Bitcoin may likely reach the potential resistance levels of $7,300, $7,500 and $7,700. At the moment, the market may likely face an upward movement as the RSI (14) indicator moves above the 47-level.
Please note: Insidebitcoins.com is not a financial advisor. Do your research before investing your funds in any financial asset or presented product or event. We are not responsible for your investing results.
Join Our Telegram channel to stay up to date on breaking news coverage