Join Our Telegram channel to stay up to date on breaking news coverage
Bitcoin (BTC) Price Prediction – February 25
The price of Bitcoin has failed to find support at $9,600 and $9,400, giving more control to the sellers.
BTC/USD Long-term Trend: Bullish (Daily Chart)
Key levels:
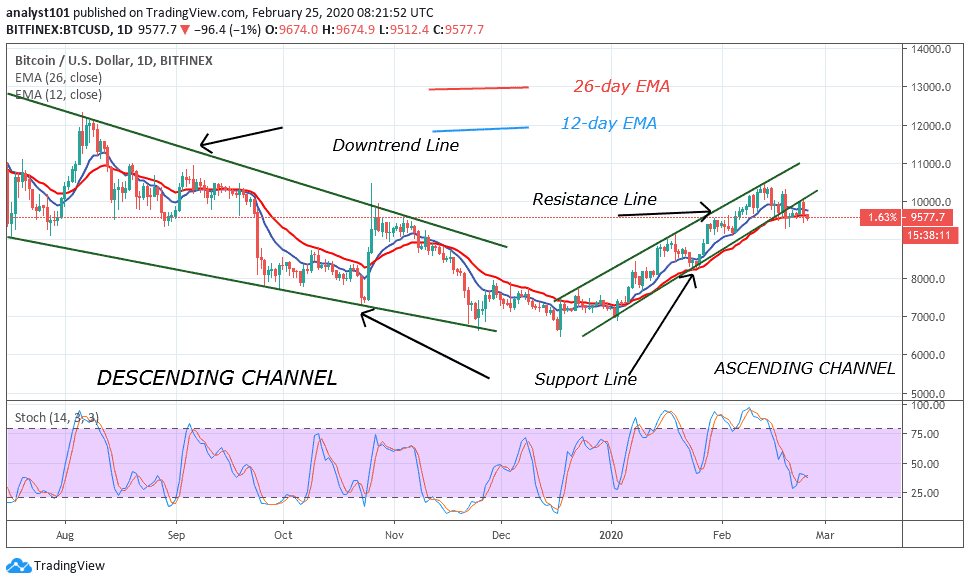
Resistance Levels: $10,200, $10,400, $10,600
Support Levels: $8,600, $8,400, $8,200
BTC/USD has been very volatile for the past three weeks. While the coin reached its new year’s high at $10,500 some days ago, the fluctuations to both sides refuse to calm down. Unfortunately to the bulls, and following the massive global markets crisis, BTC/USD had completed almost $600 drop-in just two days.
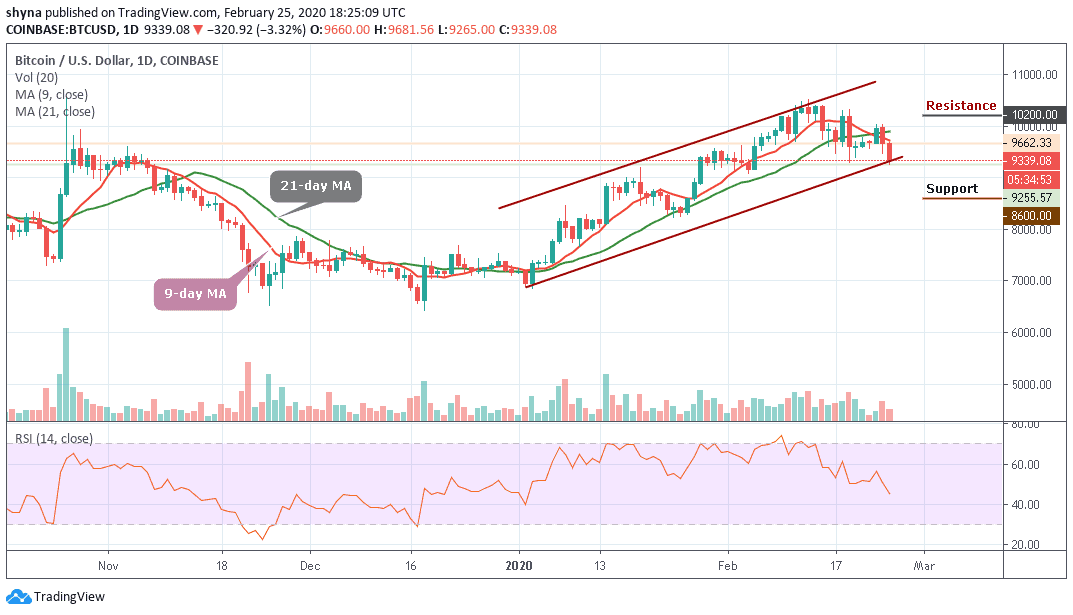
At the time of writing, BTC/USD is testing the crucial support of the lower ascending trend-line, moving below the 9-day and 21-day moving averages at $9,339. Both the market price and the RSI (14) seem to be on a critical decision point. Therefore, losing the $9,300 support level means losing the higher lows trajectory on the daily, this might be crucial for the short-term price action for Bitcoin.
Moreover, in case of a breakdown, the first level of support is likely to be at $9,000 before $8,800. Further down lies at $8,600, $8,400 and $8,200. Should in case the coin finds support here, then the first level of resistance would be $9,800 and $10,000. Further rise may be $10,200, $10,400 and $$10,600 respectively.
BTC/USD Medium – Term Trend: Bearish (4H Chart)
If you look at the 4-hour chart, the Bitcoin price is still under $9,400 and could continue to weaken if the price continues to fall below the 9-day and 21-day moving averages. However, once the current correction is completed, it may likely reach $9,000, $8,800 and $8,600 support levels where the price could allow a decent recovery.
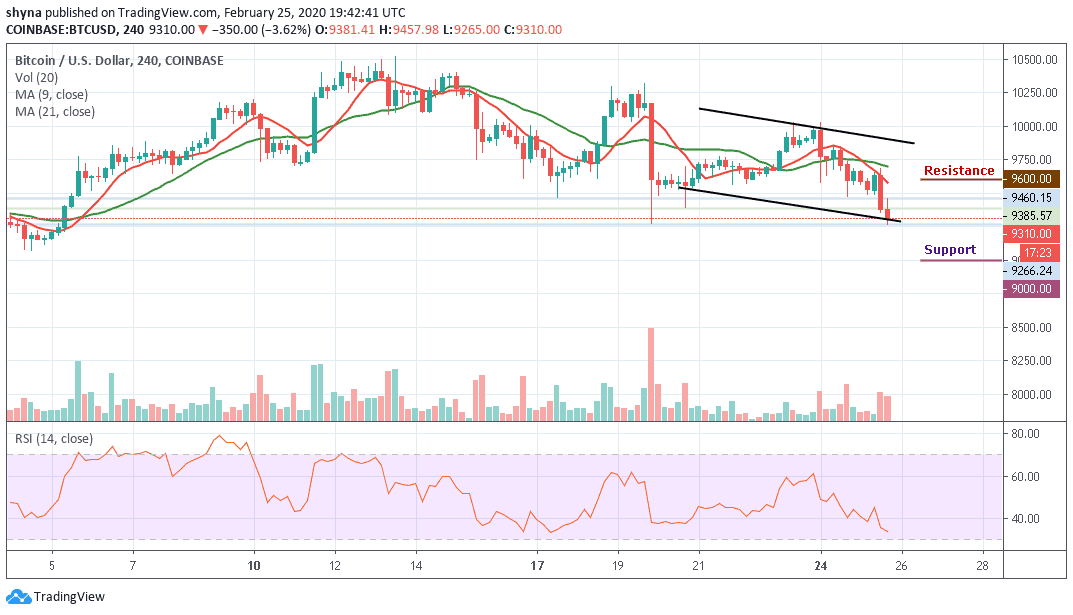
Similarly, the technical indicator RSI (14) shows a downward price momentum, as it is in the bearish zone and the signal line is moving below the 35-level. Therefore, the coin may experience further resistance of $10,000 if it raises the much-needed price recovery above $9,500 which may later take the price to $9,600 and $9,800 resistance levels.
Please note: Insidebitcoins.com is not a financial advisor. Do your research before investing your funds in any financial asset or presented product or event. We are not responsible for your investing results.
Join Our Telegram channel to stay up to date on breaking news coverage