
Join Our Telegram channel to stay up to date on breaking news coverage
Bitcoin price is at risk of losing a key support level, as bears wait for their downside targets for BTC. The big crypto is trading at $27,410 and the price strength shows that it is headed for lower levels. BTC had dropped 7.33% over the last seven days and was 0.95% down on the day.
Bitcoin is trading in a third straight bearish session leaving traders wondering where the bottom for the ongoing correction will be set.
Bitcoin Bulls Need To Aggressively Defend $27,000
After rising to nine-month highs at $31,050 on April 14, Bitcoin price embarked on a downtrend that was halted at the 50-day Simple Moving Average (SMA) that was sitting just above the $27,000 psychological level. The big crypto has been trading above this level for the last six days, suggesting that the bulls are aggressively defending the said level.
Therefore, a daily candlestick close below the 50-day SMA, which currently sits at $$27,223 would signal weakness amongst the buyers to fight off the ongoing correction. Such a scenario would see the flagship cryptocurrency fall below $27,120 to tag the $26,000 psychological level.
Below that, BTC would drop to revisit the 100-day SMA at $25,097, the major support level at $22,000, or the 200-day SMA at $21,520.
In highly bearish cases, Bitcoin bulls may retreat toward the $20,000 psychological level, where they could regroup and buy more on the dip before kickstarting another recovery. Such a move would signal a 26% descent from the current price.
BTC/USD Daily Chart
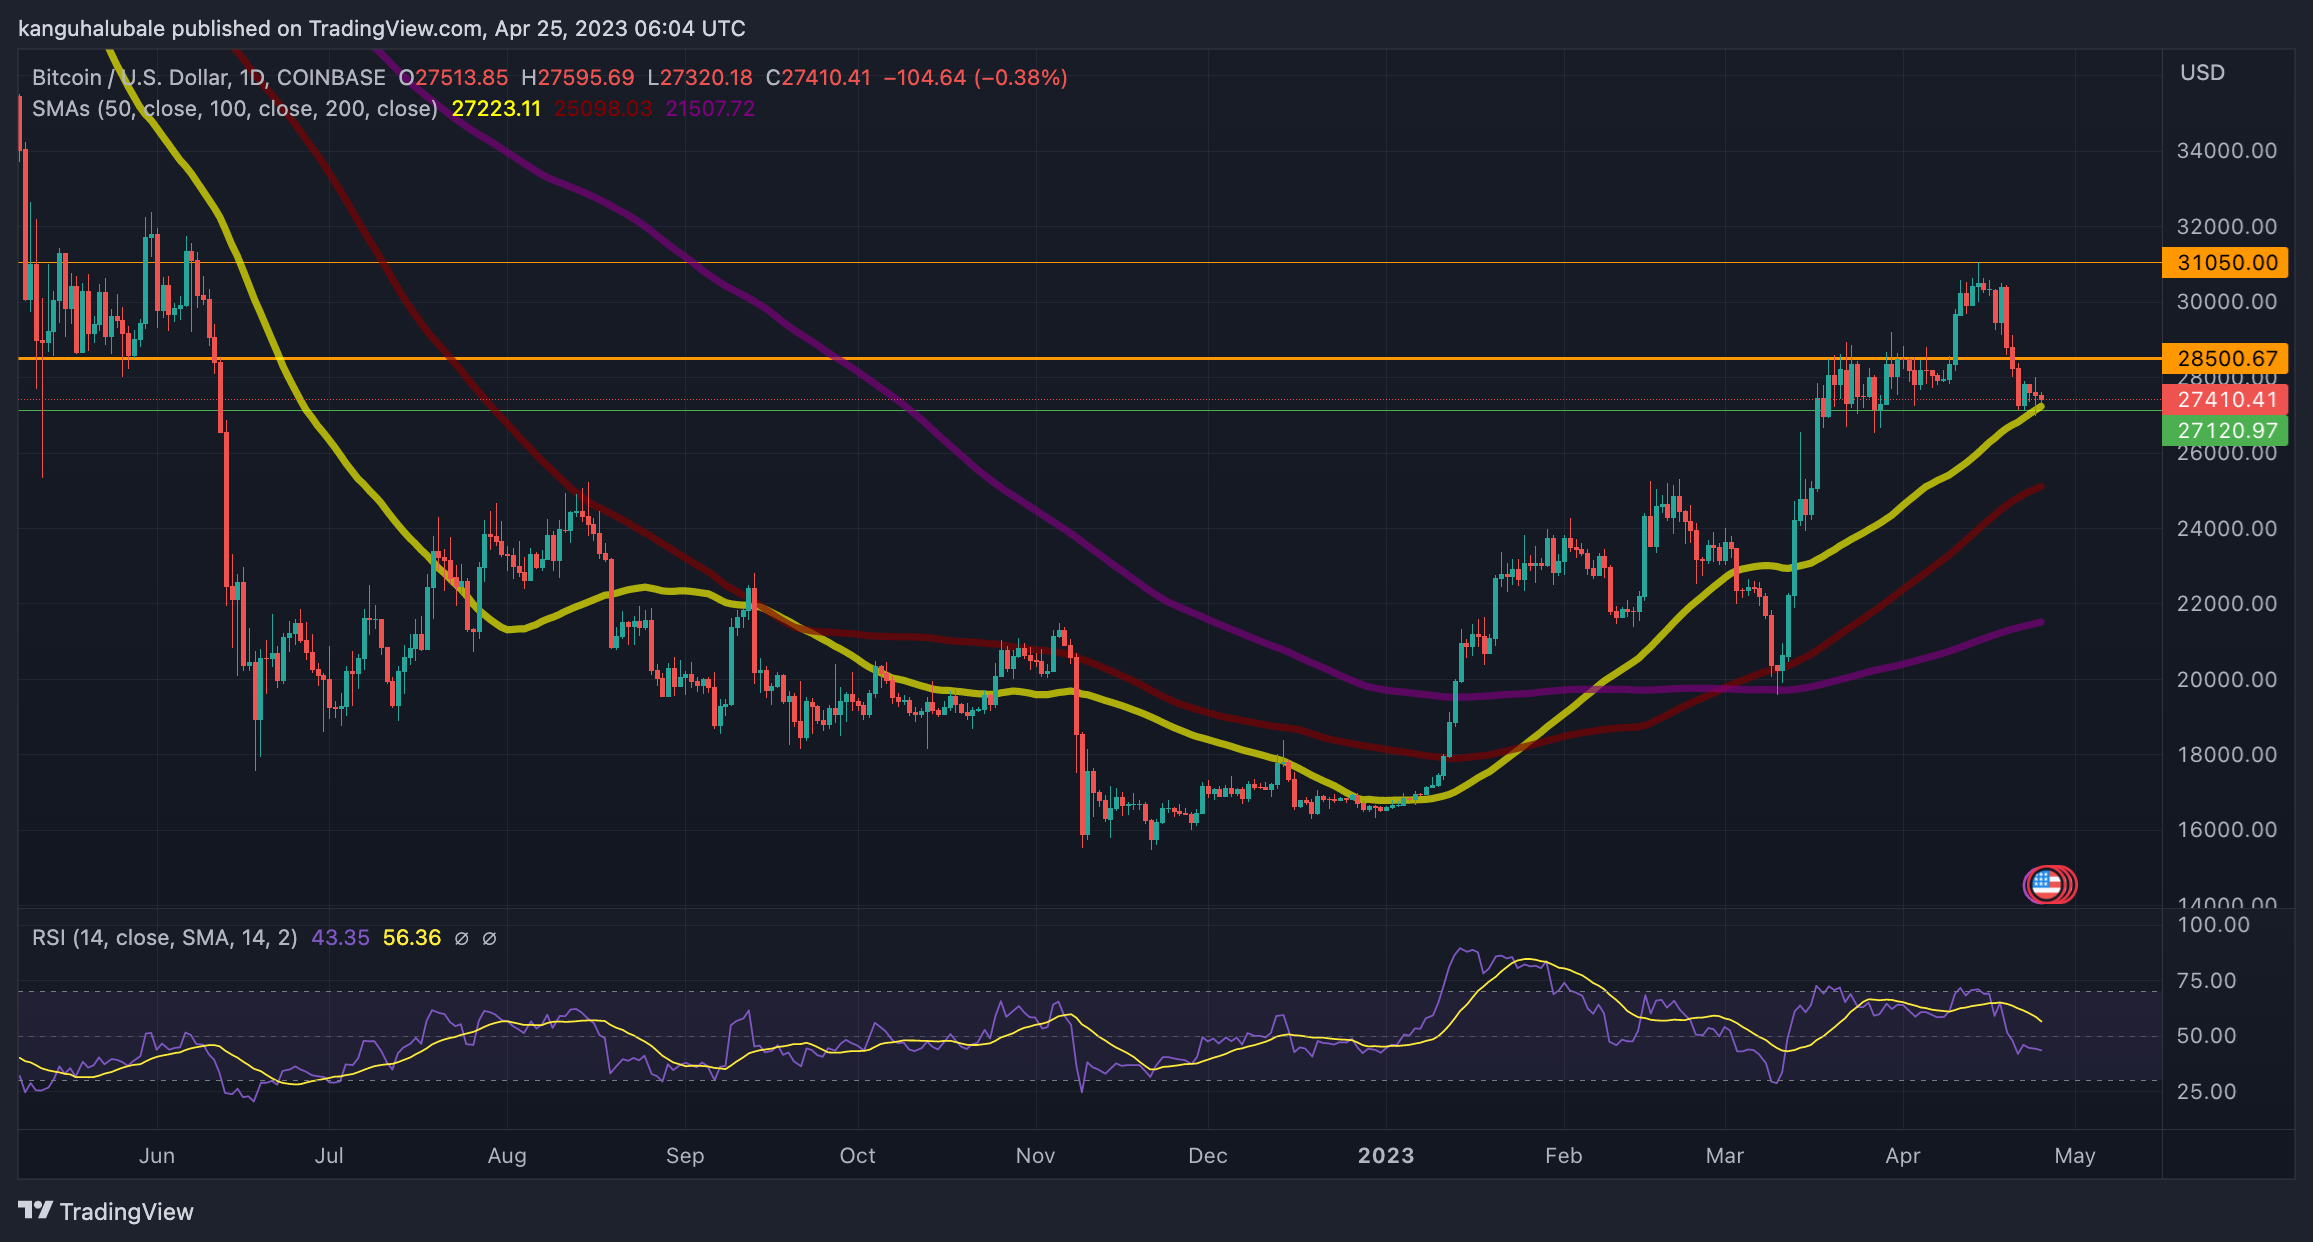
Validating this downward outlook for Bitcoin was the movement of the Relative Strength Index (RSI) in the negative region. The price strength at 43 below the midline suggested that the bears were returning to the market and began taking control of the pioneer crypto.
Additionally, BTC faced a stiff hurdle in its upward path. This was the supplier congestion area between $28,500 and the $32,000 psychological level, represented by the orange lines on the daily chart above.
The significance of this supply zone is validated by the fact that the last time Bitcoin was rejected from this level in June 2022, it went on to plummet 44% setting a swing low below $18,000.
If the same scenario plays out again, it implies that the ongoing correction is not over, adding credence to the negative narrative.
On the flip side, Bitcoin was trading above all the major SMAs, a suggestion that there were still more buyers than sellers in the market. The positive divergence from the RSI suggested that there was still some room for the upside.
As such, if buyers succeed in keeping BTC above the 50-day SMA, the price could be bolstered higher toward the lower limit of the supply zone at $28,500. A rise above this level could mean that the largest cryptocurrency by market cap could remain oscillating within the resistance zone for some time before any fundamentals or macro events propel it higher.
Related News:
- Bitcoin Price Drops To $27,600 – What Can Reverse BTC’s Fortunes?
- Russia is Now the Second-Largest Bitcoin Mining Hub After the U.S.
- Best Crypto to Buy Now
Join Our Telegram channel to stay up to date on breaking news coverage