

Join Our Telegram channel to stay up to date on breaking news coverage
BCH Price Analysis – February 9
Bitcoin Cash (BCH) is making an attempt to settle above $450 after buying activity at $446 increased significantly.
BCH/USD Market
Key Levels:
Resistance levels: $500, $520, $540
Support levels: $380, $360, $340
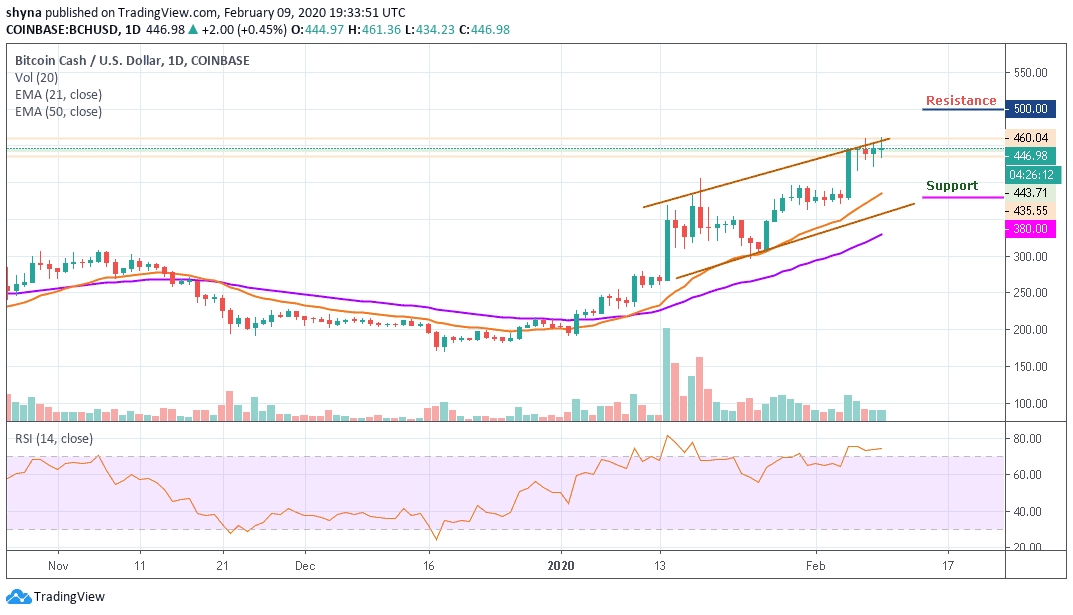
At the time of writing, BCH/USD is doddering at $446. The price has corrected upwards 0.45% but the previous push upwards met intense resistance at $460. If this resistance is not cleared, BCH could eventually succumb to losses heading to $400 in order to create fresh demand and momentum to assault the resistance levels.
From a technical perspective, the momentum and the trend are largely in the hands of the bulls. The RSI (14) at 73 shows that BCH is not extremely overbought and there is still room for growth. A bullish cross around the upper boundary of the ascending channel is likely to continue in the coming trading session.
Meanwhile, if there is an increase in buying pressure, the price may break out of the ascending channel to reach the $480 resistance. While trading at $480, a bullish continuation could reach the resistance levels of $500, $520 and $540 respectively.
In other words, should the market drives below the $420 support, the BCH price may likely slump to the initial support at $400, which may later bring the price back below the 21 periods EMA to its critical supports at $380, $360 and $340.
BCH/BTC Market
When compared with Bitcoin, the daily chart reveals that the bears have started showing some commitment to BCH trading because of the recent rise of BTC. However, following the recent negative signs, the trend may continue to go down if the sellers continue to pump more pressure into the market.
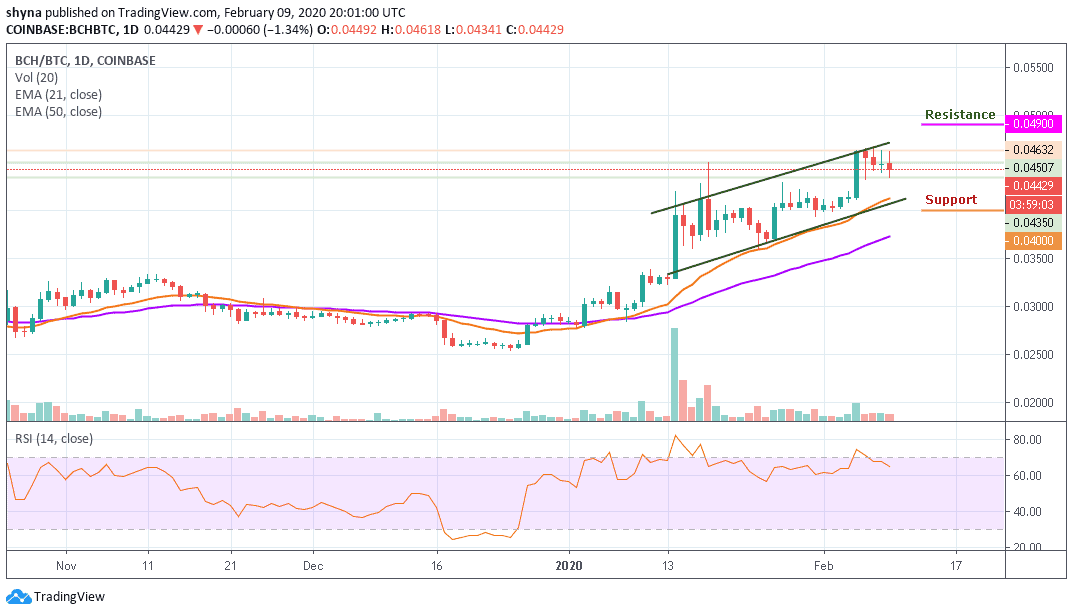
Moreover, as the RSI (14) signal line nosedives to 65-level, if the buyers can hold the support of 0.043 BTC, the market price may likely continue an upward movement, pushing further can take it to the resistance level of 0.049 BTC and 0.051 BTC but a retest could lower the price to 0.040 BTC and 0.038 BTC support levels.
Please note: Insidebitcoins.com is not a financial advisor. Do your research before investing your funds in any financial asset or presented product or event. We are not responsible for your investing results.
Join Our Telegram channel to stay up to date on breaking news coverage
