Join Our Telegram channel to stay up to date on breaking news coverage
BCH Price Prediction – June 2
Bitcoin Cash withdraw from the monthly high at $269.62 is necessary for the next rally as long as $235 support is not broken.
BCH/USD Market
Key Levels:
Resistance levels: $290, $310, $330
Support levels: $225, $205, $185
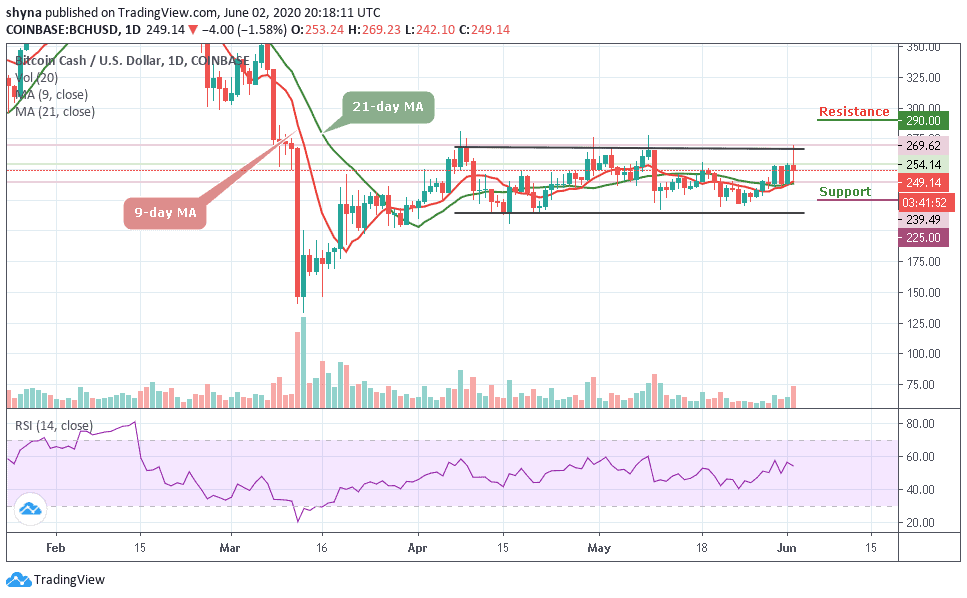
For the past few months, the BCH/USD price has been moving in sideways to support the market, against selling pressure. However, should Bitcoin Cash fall back to the old support and break-even, the bears might come back to dominate the market but at the time of writing, the bulls are still in charge. Therefore, traders can expect a bullish continuation before any reversal come into play.
Moreover, BCH/USD shifted its focus to $300 after clearing resistance at $260, although, the coin was extremely unstable for the past few days of trading. Nevertheless, the Bitcoin Cash touched $269 in the early hours of today before plunging back to $239. At the time of writing, Bitcoin Cash is following a bullish trend and trading at $249.14 above the 9-day and 21-day moving averages within the channel.
On the other hand, if the market drives below the moving averages, the BCH price may slump to the initial support at $230, which may later bring the price back to its critical supports at $225, $205 and $185. Presently, the RSI (14) stays above average at 54-level, this could increase the buying pressure and it may likely break out of the channel to reach the $280 resistance level. Meanwhile, a bullish continuation could hit the resistance levels at $290, $310 and $330.
Comparing with Bitcoin, the daily chart reveals that the traders are yet to show a strong commitment to buying in the market. Meanwhile, in as much as the bulls turn strong now, we may expect the market to skyrocket to the resistance levels of 0.0290 BTC and 0.0300 BTC.
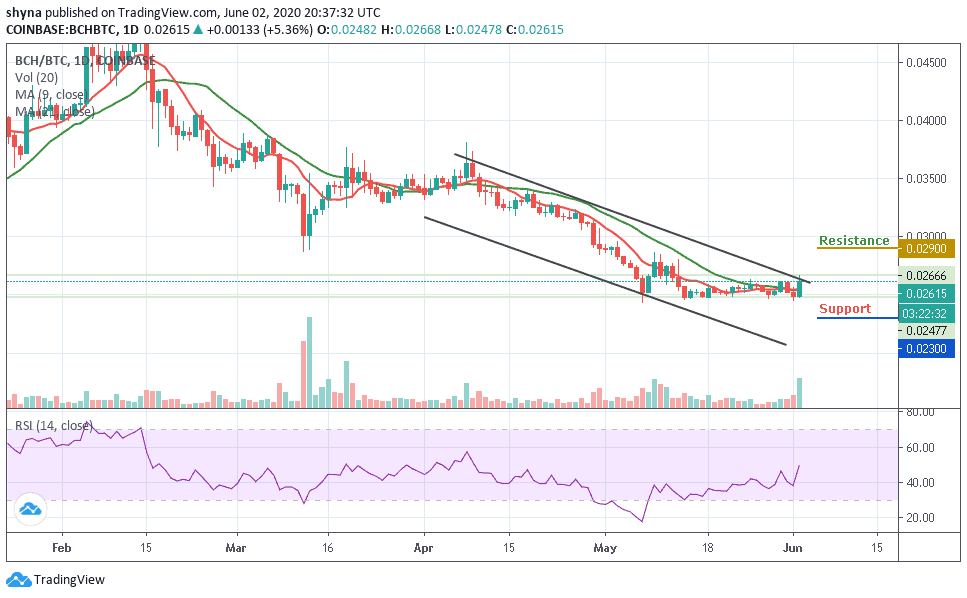
In addition, the 0.0230 BTC and 0.0220 BTC levels may likely produce support for the market should in case the buyers fail to push the price to the north. The BCH/BTC pair may continue to remain in a downward range while the RSI (14) signal line moves to cross 50-level.
Please note: Insidebitcoins.com is not a financial advisor. Do your research before investing your funds in any financial asset or presented product or event. We are not responsible for your investing results.
Join Our Telegram channel to stay up to date on breaking news coverage