Join Our Telegram channel to stay up to date on breaking news coverage
BCH Price Prediction – December 14
Bitcoin Cash is back below the moving averages amid widespread declines in the crypto market.
BCH/USD Market
Key Levels:
Resistance levels: $310, $320, $330
Support levels: $235, $225, $215
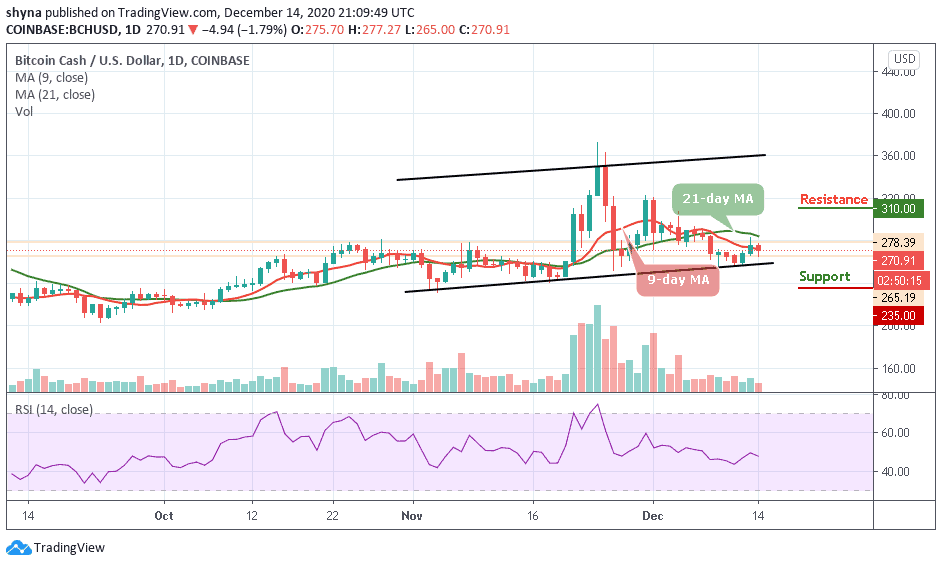
Looking at the daily chart, BCH/USD could no longer defend the $280 level again as the coin hovers around $270.91. The coin is now moving below the 9-day and 21-day moving averages, indicating a bearish movement. For the time being, the market price may be heading towards the lower boundary of the channel as the RSI (14) moves below the 50-level.
What to Expect from Bitcoin Cash (BCH)
If the market drives below the lower boundary of the channel, the Bitcoin Cash price could slump to $235, $225, and $215, bringing the price to a new low. Meanwhile, a strong buying pressure may need to take the price above the moving averages to $295 resistance. While trading at this level, a bullish continuation could likely to touch the $310, $320, and $330 resistance levels.
Now that the BCH/USD pair is now rolling back beneath the moving averages, especially towards the lower channel trend line, traders need to have a clear climb back above the 21-day MA before the market can experience another bull-run. Otherwise, the BCH market may remain in its perpetual bearish condition or move sideways.
Against Bitcoin, the daily chart reveals that the bears have been keeping the downside. Meanwhile, looking at the recent negative sign, the trend may continue to go down if the sellers could continue to pump more pressure into the market.
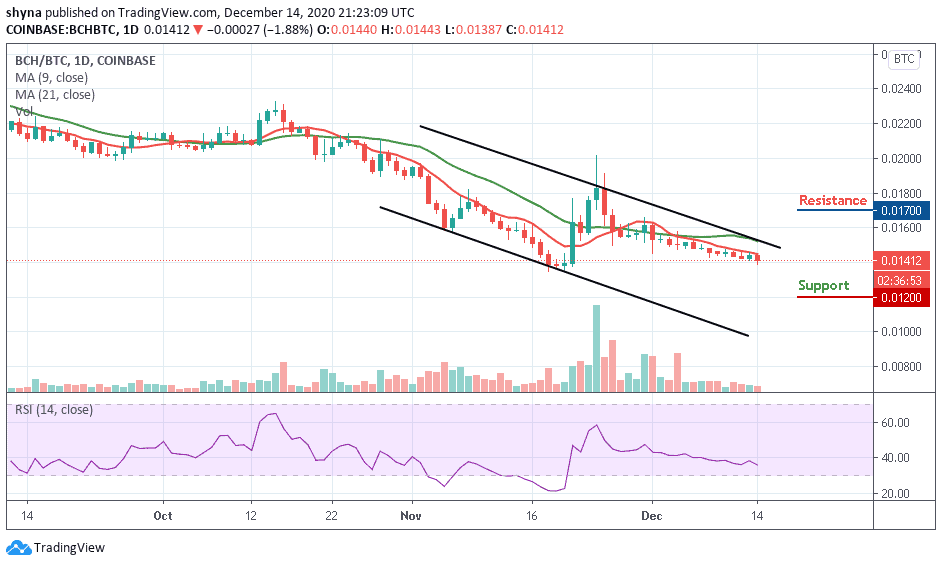
More so, if the buyers can hold the support of 0.014 BTC, the market price may likely resume an upward trend and cross the 9-day and 21-day moving averages to reach the resistance level of 0.016 BTC and probably hit the potential resistance of 0.0170 BTC but a retest could lower the price to 0.012 BTC and 0.010 BTC support levels but the technical indicator RSI (14) is creeping below the 40-level.
Join Our Telegram channel to stay up to date on breaking news coverage
