
Join Our Telegram channel to stay up to date on breaking news coverage
BCH Price Prediction – October 29
Bitcoin Cash (BCH) is defiantly positive as the bulls push its value 11.39% higher.
BCH/USD Market
Key Levels:
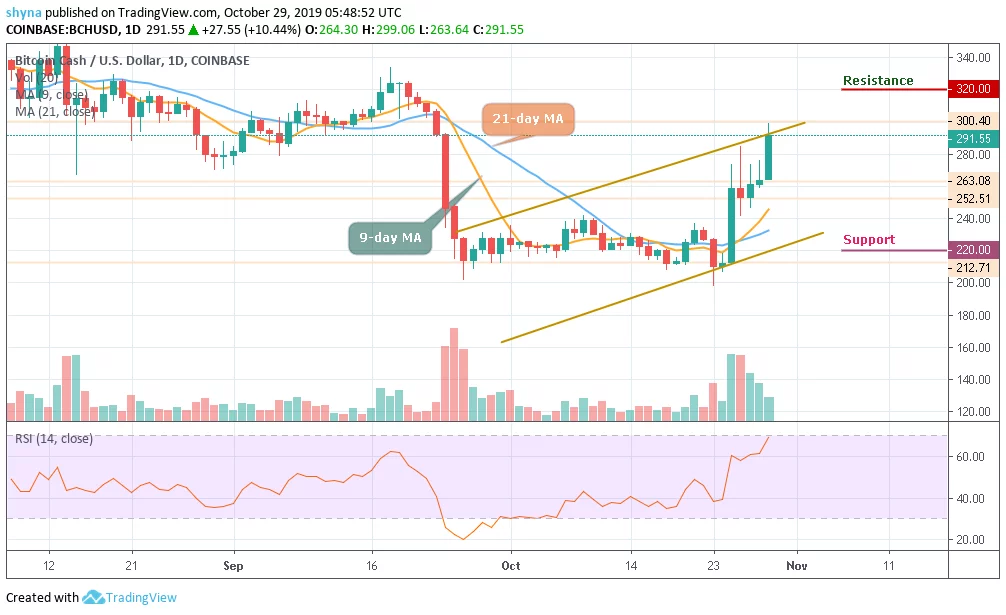
Resistance levels: $320, $330, $340
Support levels: $220, $210, $200

Bitcoin Cash shifted its focus to $300 after clearing resistance at $290. Last week was extremely unstable for BCH. From testing levels below $200, the crypto scaled the levels towards $300. However, Bitcoin Cash reached $300 in the early hours of today before plunging back to $291. At the time of writing, Bitcoin Cash is following a bullish trend and trading at $291 above the 9-day and 21-day moving averages within the ascending channel.
On the other hand, if the market drives below the $260 support, the BCH price may likely slump to the initial support at $240, which may later bring the price back to its critical supports at $220, $210 and $200. But presently, the RSI (14) is about to enter into the overbought zone and this could increase the buying pressure as the price is about to break out of the ascending channel to reach the $300 resistance. While trading at $300, a bullish continuation may likely touch the resistance levels of $320, $330 and $340.
In other words, over the past couple of weeks, the BCH price range has continued to support the market, against selling pressure. However, should Bitcoin Cash fall back to the old support and break-even, the bears might assume control of the market. But as it stands now, the bulls are still in charge. Therefore, we can still expect a bullish continuation before a reversal come into play.
Against Bitcoin, the price has been making attempt to rise against Bitcoin but as it appeared, there’s a low amount of buying pressure in the market which is why the price slumped most of the time. As the MACD indicator is making an attempt to cross to the positive side, the bulls need to make use of this opportunity and push the price above the channel by moving it towards the nearest resistance at 0.033 BTC and above.
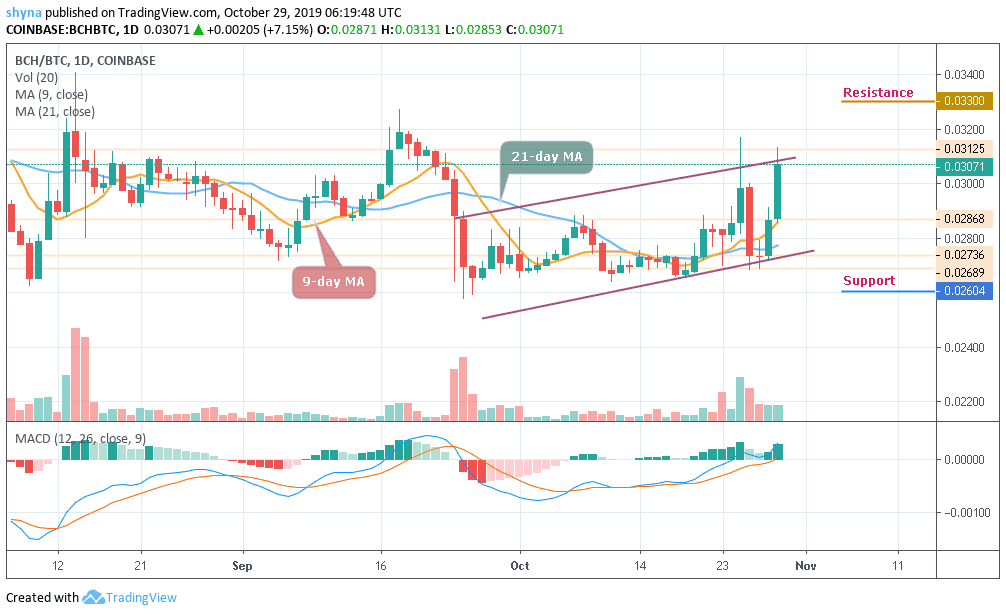
Nevertheless, should in case the bulls fail to inject strong buying pressure into the market; the price may likely fall below the moving averages of 9-day and 21-day to the support level of 0.028 BTC and while trading at this level, a breach could slump the market to a critical support of 0.026 BTC, creating a new low below the rising channel.
Please note: Insidebitcoins.com is not a financial advisor. Do your research before investing your funds in any financial asset or presented product or event. We are not responsible for your investing results.
Join Our Telegram channel to stay up to date on breaking news coverage