Join Our Telegram channel to stay up to date on breaking news coverage
Bitcoin Cash Price Prediction – February 1
The Bitcoin Cash price prediction shows that BCH is trading below the moving averages as the price moves in sideways.
BCH/USD Market
Key Levels:
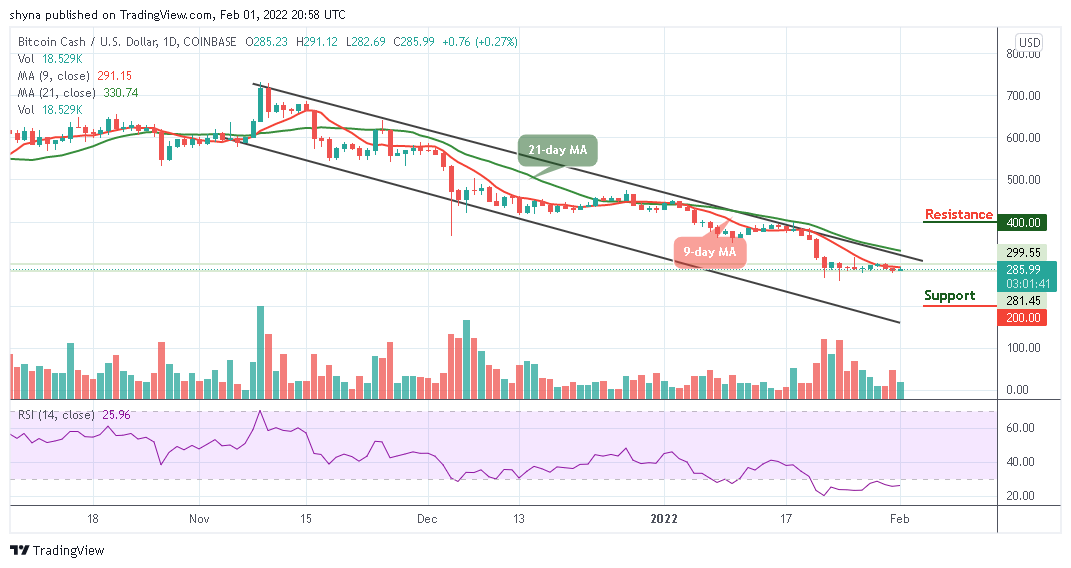
Resistance levels: $400, $420, $440
Support levels: $200, $180, $160
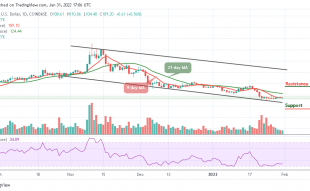
BCH/USD continues to follow sideways movement since the past few days. However, the coin has not been able to maintain a consistent bullish run within the daily chart, but it is likely for the coin to show some signs of upward movement till a cross above the 9-day moving average comes to focus. Moreover, the reason why the Bitcoin Cash remains below the 9-day and 21-day moving average could be because of the technical indicator that remains within the oversold region.
Bitcoin Cash Price Prediction: BCH Gets Ready for a Spike to the North
At the time of writing, the Bitcoin Cash price continues to consolidate itself within the descending channel staying below the 9-day and 21-day moving averages. Meanwhile, the daily breakdown reveals that BCH/USD may increase in price where it can move from $285 resistance level to hit another higher resistance at $300. Therefore, the bulls need to hold the current price tightly in order to go higher and if this is achievable, more prices break out may occur as the buyers may find the potential resistance levels at $400, $420, and $440 respectively.
On the contrary, if the bears step into the market and bring the price lower; BCH/USD may likely fall towards the channel at $250 and while trading at this level, the market could slide to the critical supports at $200, $180, and $160. Now, the Relative Strength Index (14) keeps moving in the same direction within the oversold region, but a bullish cross may reveal a buy signal for the market.
Again Bitcoin, the market is now following a bearish movement as the price remains under the 9-day and 21-day moving averages around the lower boundary of the channel while the technical indicator Relative Strength Index (14) moves within the oversold condition.
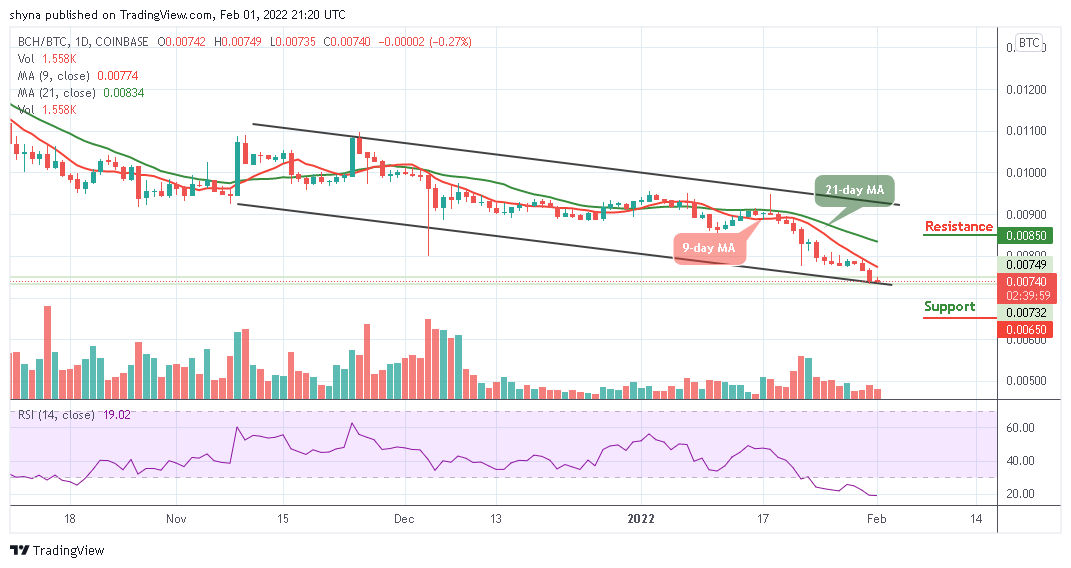
However, the sellers continues to increase their entries as the Bitcoin Cash gets ready to break below the lower boundary of the channel. More so, if the bears succeeded in breaking the barrier, the market is likely to fall towards the support level of 650 SAT and below while a rebound could increase it to the resistance level of 850 SAT and above.
Looking to buy or trade Bitcoin Cash (BCH) now? Invest at eToro!
68% of retail investor accounts lose money when trading CFDs with this provider
Read more:
- How to buy Bitcoin Cash
- How to buy Cryptocurrency
Join Our Telegram channel to stay up to date on breaking news coverage