Join Our Telegram channel to stay up to date on breaking news coverage
BCH Price Prediction – June 14
In the past few days, BCH/USD price actions are consolidating below the moving averages.
BCH/USD Market
Key Levels:
Resistance levels: $260, $280, $300
Support levels: $215, $195, $175
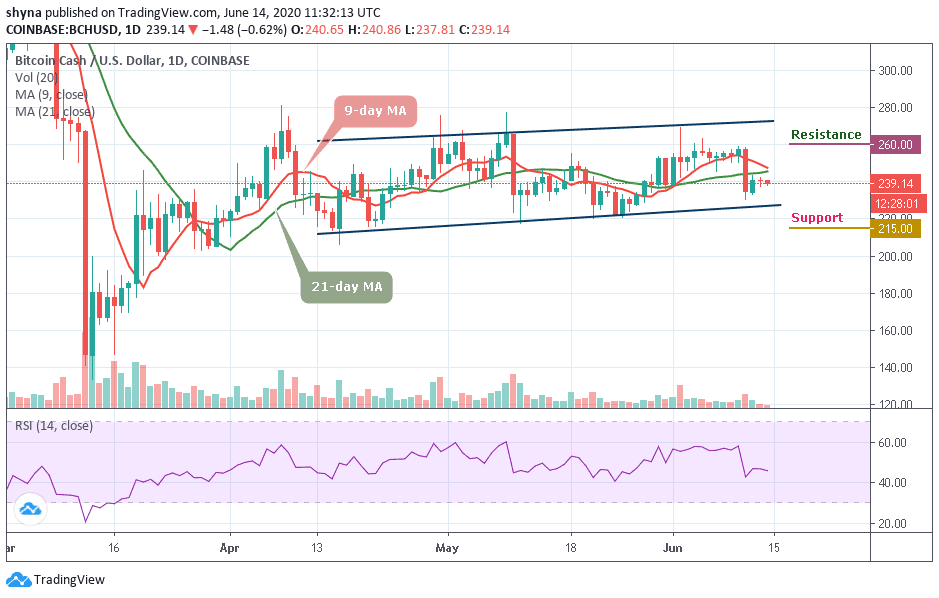
BCH/USD is currently battling with the bearish pressure that continues to dominate the entire crypto landscape. A few actions were witnessed to the upside over the past few days. However, the zone between $235 and $240 remained intact as the key support level. The bulls are keen to ensure that the price stays above thec9-day and 21-day moving averages.
Moreover, despite the fact that the price reached as high as $242 yesterday, it was unable to maintain its performance and started to recede downwards. At the moment, BCH/USD moves below the 9-day and 21-day moving averages but the present trend indicates that BCH prices may fall marginally before the day runs out.
Furthermore, if the market drives below the $220 support, the BCH price could slump to $215, $195, and $175, bringing the price to a new monthly low as the RSI (14) is heading towards the 45-level. Meanwhile, if the bulls can hold the support at $235, a strong buying pressure may likely take the price to $240 resistance. While trading at $250, a bullish continuation could touch the resistance levels at $260, $280, and $300.
Against Bitcoin, the last few days have given the bears an upper hand in controlling the market. Following the recent negative sign, the BCH/BTC trend may continue to go down in as much as the sellers keep on pumping more pressure into the market.
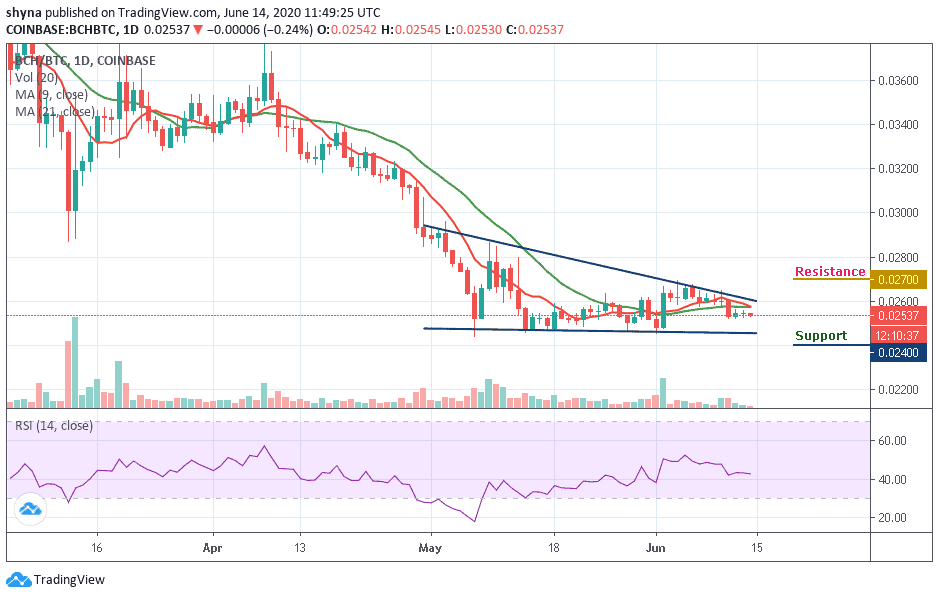
Looking at the daily chart, the market price may likely resume an upward trend if the bulls can hold the price at 2537 SAT and cross above the moving averages to reach the resistance level of 2700 SAT and above but as the technical indicator RSI (14) moves in the same direction, a retest could lower the price of the coin to the supports of 2400 SAT and 2200 SAT.
Please note: Insidebitcoins.com is not a financial advisor. Do your research before investing your funds in any financial asset or presented product or event. We are not responsible for your investing results.
Join Our Telegram channel to stay up to date on breaking news coverage
