

Join Our Telegram channel to stay up to date on breaking news coverage
BCH Price Analysis – May 5
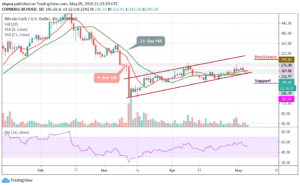
The price of Bitcoin Cash seems to be caught between the bull and the bear as the coin fluctuates in sideways.
BCH/USD Market
Key Levels:
Resistance levels: $295, $315, $335
Support levels: $200, $180, $160
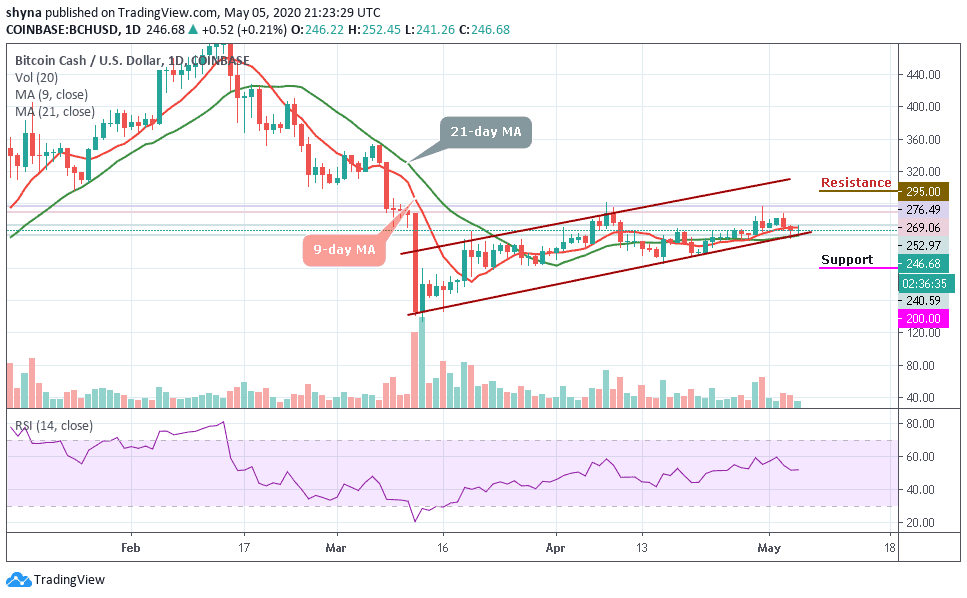
BCH/USD has been showing an uneven movement with several falls more than rises and it has not been able to maintain a consistent bullish run. Meanwhile, for the past few days, the market has been forming a pattern where the day begins with either having an uptrend or downtrend, but towards the end, it reverses.
Looking at the daily chart, BCH/USD price has continued to consolidate itself in a flag formation, waiting for a cross below the 21-day moving average. More so, the daily breakdown reveals that BCH/USD before touching $269.06, dropped to $240.59 at the opening of the market today after which it corrected itself to where it is trading currently at $246.68 level. If the support gets weak, a price break-down may occur as the bears may find new weekly lows at $200, $180, and $160 support levels.
Nevertheless, a bullish step back may likely roll back the market to $275 resistance with a possible break above the moving averages and could move towards the $295, $315, and $335 resistance levels, establishing a new weekly high for the market. At the moment, the RSI (14) indicator is moving in the same direction around 52-level. Meanwhile, a bullish cross above 60-level might reveal more buy signals for the market.
Against Bitcoin, BCH performance has been very low due to a recurring bearish sentiment which has caused the market to fall drastically. As the price falls, sellers are posing an additional threat for buyers to reach the 0.027 BTC where the nearest target is located. In addition, any eventual break below the lower side of the descending channel may cause Bitcoin Cash to collapse.
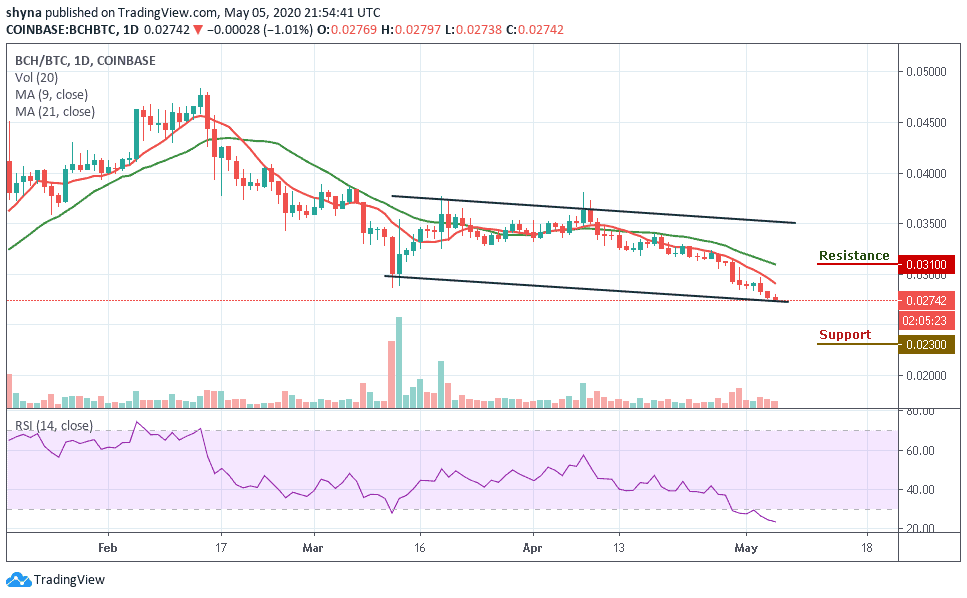
Meanwhile, for a positive upsurge, the 0.031 BTC and above are the major resistance levels for the coin for now. Therefore, a bearish continuation could test the important support at the 0.023 BTC and below. The trading volume is fading away while the RSI (14) is at the oversold zone, waiting for buying pressure when the indicator faces up.
Please note: Insidebitcoins.com is not a financial advisor. Do your research before investing your funds in any financial asset or presented product or event. We are not responsible for your investing results.
Join Our Telegram channel to stay up to date on breaking news coverage
