Join Our Telegram channel to stay up to date on breaking news coverage
Bitcoin (BTC) Price Prediction – May 5
The daily chart reveals that the Bitcoin price soars within an ascending channel to settle above $8,900 in the journey to $9,000.
BTC/USD Long-term Trend: Bullish (Daily Chart)
Key levels:
Resistance Levels: $10,500, $10,700, $10,900
Support Levels: $7,400, $7,200, $7,000

Today, BTC/USD short-term price action has formed a wedge that has clearly broken to the upside. This has resulted in price levels attempting to continue the uptrend. Buying volume has yet to flood back into the market and will be required in order to sustain any form of a new uptrend.
More so, BTC/USD is struggling to climb higher above the $9,000 resistance as the coin is settling in a tight range between $8,800 and $9,182 above the 9-day and 21-day moving averages. Typically when the new uptrend movements are beginning to form, buyers may use the moving averages as the nearest support levels. But in as much as the red-line of 9-day MA is above the green-line of 21-day MA, the market could still remain in the upward movement.
Moreover, if the market decides to go down, Bitcoin’s price may drop below the 9-day moving average at $8,400, and should this support fails to contain the sell-off, we may see a further drop to $7,400, $7,200 and critically $7,000. The resistance levels to watch are $10,500, $10,700 and $10,900 respectively. Meanwhile, the RSI (14) signal line is moving in the same direction within the overbought zone, suggesting a sideways movement.
BTC/USD Medium-Term Trend: Ranging (4H Chart)
Looking at the 4-hour chart, the bears wanted to step back into the market by bringing the price from $9,132 to $8,776, but the bulls quickly held the support by picking the price from there to where it is currently trading at $8,945 which is above the 9-day and 21-day moving averages. Meanwhile, the $9,400 and above may come into play if BTC/USD breaks above the channel.
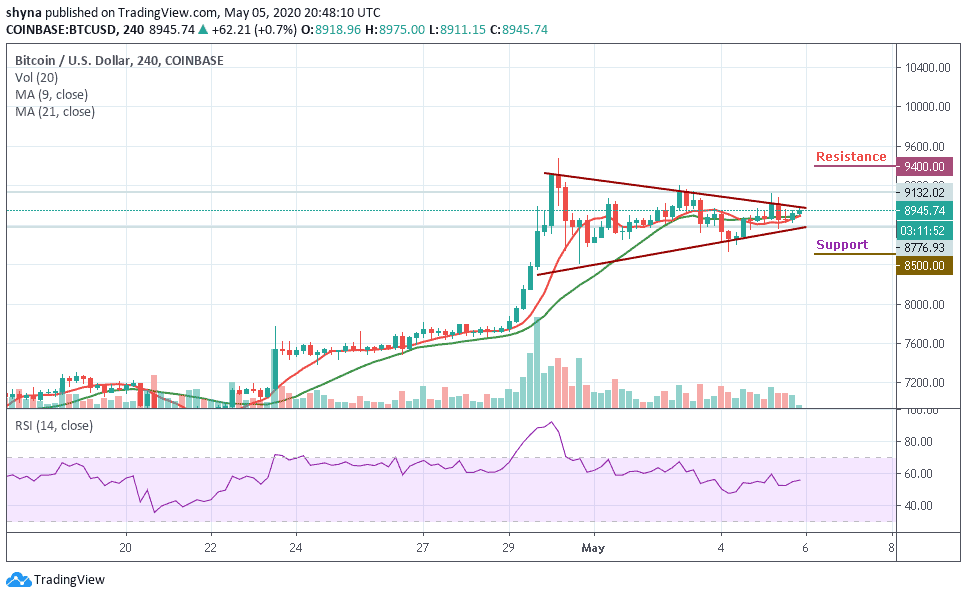
However, if the price breaks below the moving averages of the ascending channel and begins to fall, the support level of $8,500 and below may be in focus. Meanwhile, as the RSI (14) moves above 55-level, more bullish signals may likely play out.
Please note: Insidebitcoins.com is not a financial advisor. Do your research before investing your funds in any financial asset or presented product or event. We are not responsible for your investing results.
Join Our Telegram channel to stay up to date on breaking news coverage