Join Our Telegram channel to stay up to date on breaking news coverage
BCH Price Prediction – February 14
The technical indicator is trending inside the overbought zone, confirming the bullish movement within the market.
BCH/USD Market
Key Levels:
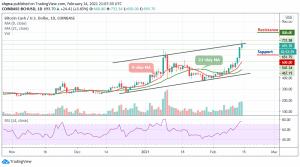
Resistance levels: $800, $850, $900
Support levels: $600, $550, $500
BCH/USD peaks at $732 today, after which it couldn’t maintain the trend as the price drops and consolidates within the channel. Meanwhile, the price not staying above $700 ruins the long-term technical picture of the coin. Bitcoin cash will have to move back to $700 to guide against the downward pressure while the closest support expects the coin at $650, which is the daily low.
What to Expect from Bitcoin Cash
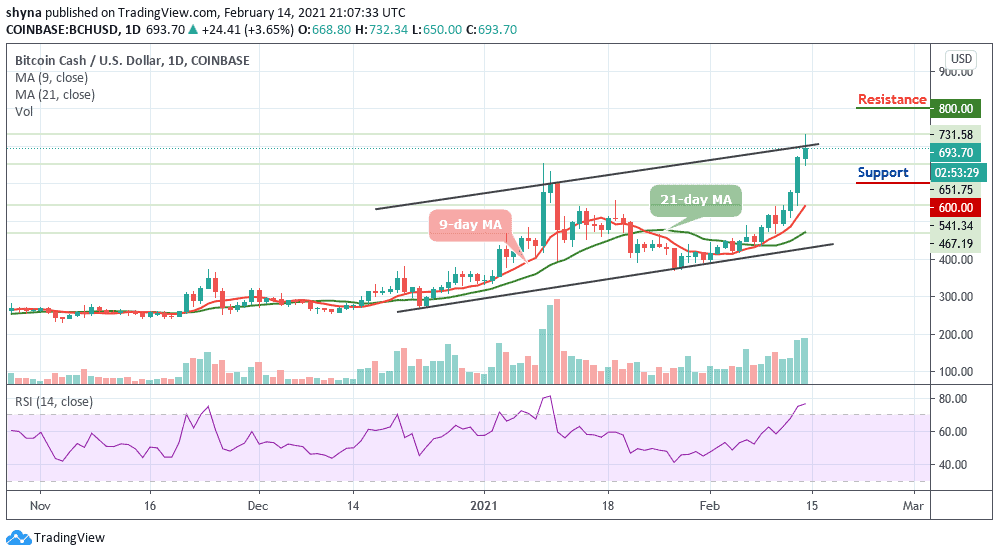
A movement towards the south may likely push the coin to the support levels of $800, $850, and $900. However, the price of the BCH is trading at $693.70 and still trading above the 9-day and 21-day moving averages. On the upside, a sustained move above the upper boundary of the channel could stop the initial downside pressure and create momentum for the bulls with the focus to move the market to the next resistance levels of $800, $850, and $900 respectively.
At the moment, the RSI (14) remains within the overbought zone, which indicates that the market follows an uptrend. Looking at the daily chart, the support formed between $700 and $650 provided tight protection which allows the buyers to concentrate on stirring action to the north.
Against BTC, when looking at the daily chart, following the trade for the past few days, bulls have shown a great commitment to BCH trading. More so, by following the recent positive sign, the trend may continue to go up if the buyers can sustain the pressure further.
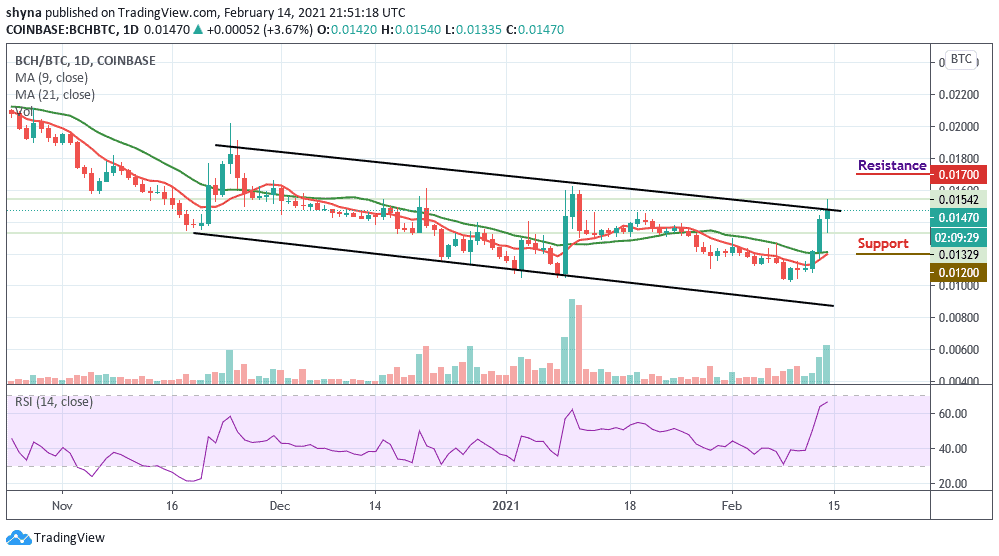
However, if the bulls succeeded in breaking the upper side of the channel, the market price may likely reach the next resistance level of 1700 SAT and 18000 SAT. In other words, a retest could allow the pair to go below the moving averages and lower the price to the support levels of 1200 SAT and 1000 SAT. With the look of things, the RSI (14) is crossing into the overbought zone which could boost the bullish movement.
Join Our Telegram channel to stay up to date on breaking news coverage
