Join Our Telegram channel to stay up to date on breaking news coverage
LTC Price Prediction – February 14
Litecoin (LTC) collapses from the intraday high of $230 level to trade near the 9-day moving average.
LTC/USD Market
Key Levels:
Resistance levels: $255, $265, $275
Support levels: $180, $170, $160

LTC/USD hits a new high of $230.81 and now dropping like a stone towards $210 in a matter of hours. At the time of writing, LTC/USD is changing hands at $214.62, down by 5.3% after a rebound from the $208.57 level. Currently, the daily chart reveals that the technical indicator is making an attempt to move out of the overbought condition, which means the coin could be vulnerable to further losses.
What is the Next Direction for Litecoin?
In as much as the coin fails to rally from current trading levels, the greater the chance that we may see the cryptocurrency falling to a new trading low. A break below the 9-day moving average at the $185 support level may provoke an even deeper decline towards the $180, $170, and $160 levels. The short-term technical analysis shows that the $210 and $205 levels are currently the strongest forms of technical support before the $200 level starts to come back into focus.
However, as the technical indicator RSI (14) remains in the overbought zone, we await the possible direction of the coin. Therefore, for a positive peak; the $255, $265, and $275 are the main resistance levels for the token at the moment. Moreover, looking at the volume of the chart, we can see the Litecoin (LTC) at its highest which also indicates that LTC/USD is bullish in the long run.
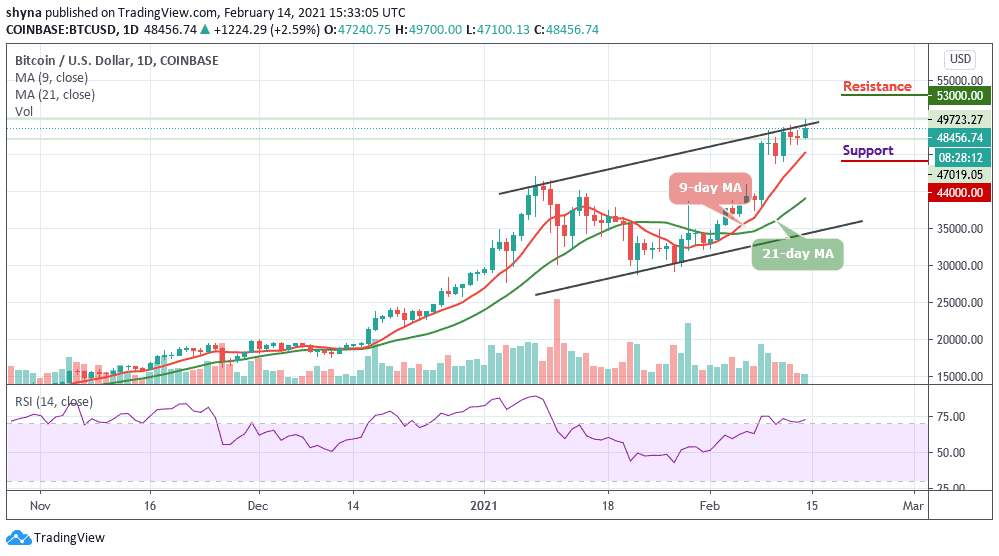
Comparing LTC with BTC, we can easily see that the pair has eventually broken solid support at 4324 SAT before a rebound back to where it is trading currently at 4406 SAT. More so, any attempt by the technical indicator to cross below the 50-level, Litecoin price could see another sharp drop at the 4200 SAT support level. Breaking this level could further take the price to the critical support levels at 4000 SAT and 3800 SAT.
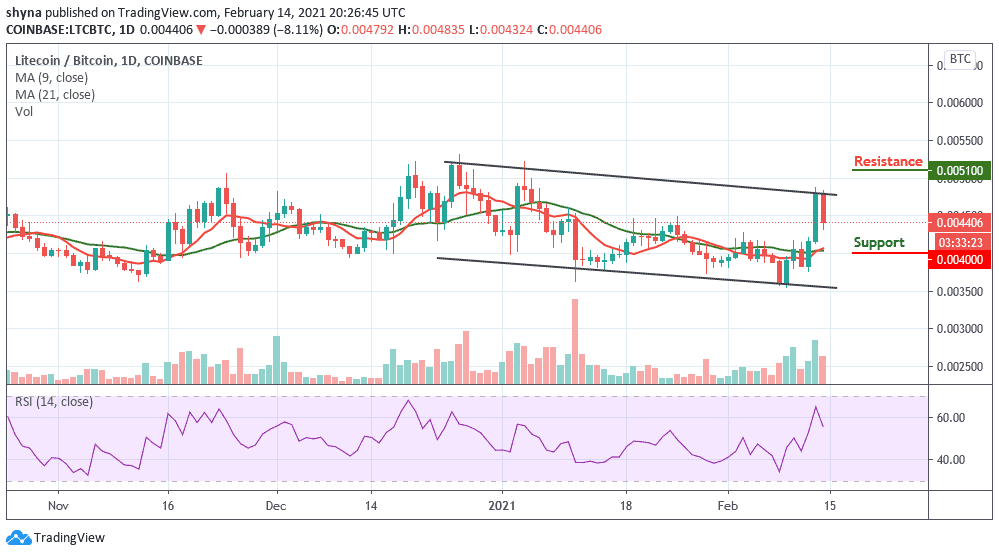
However, as the Litecoin price is trading at the 4406 SAT level, if the bulls can hold the price and move it towards the north, the coin may likely break out of the channel to retest the resistance level of 4879 SAT, the next key resistance levels lie at 5000 SAT. Reaching this level might take it to the potential resistance levels of 5100 SAT and 5300 SAT.
Join Our Telegram channel to stay up to date on breaking news coverage