Join Our Telegram channel to stay up to date on breaking news coverage
BCH Price Prediction – December 31
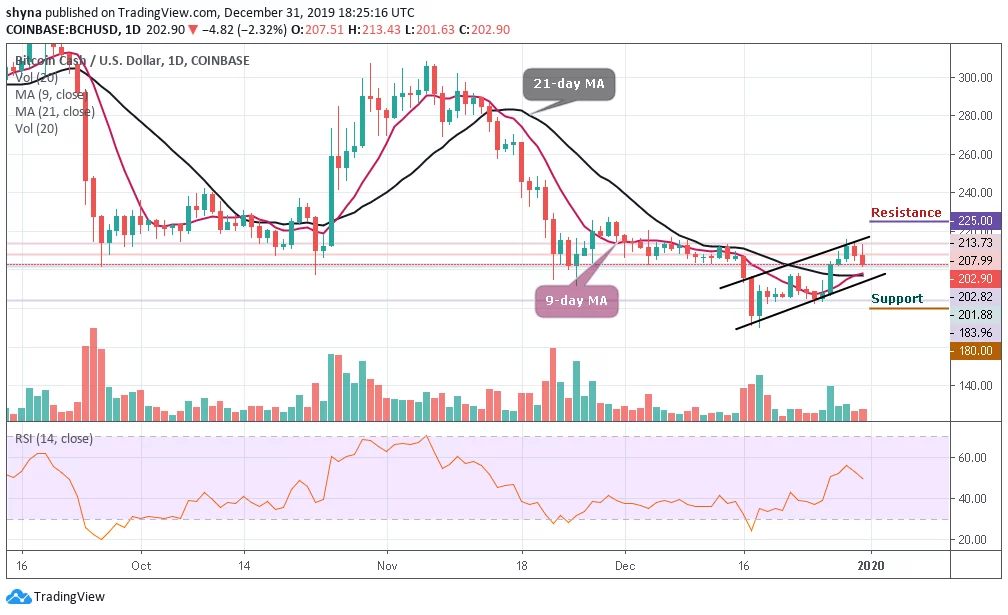
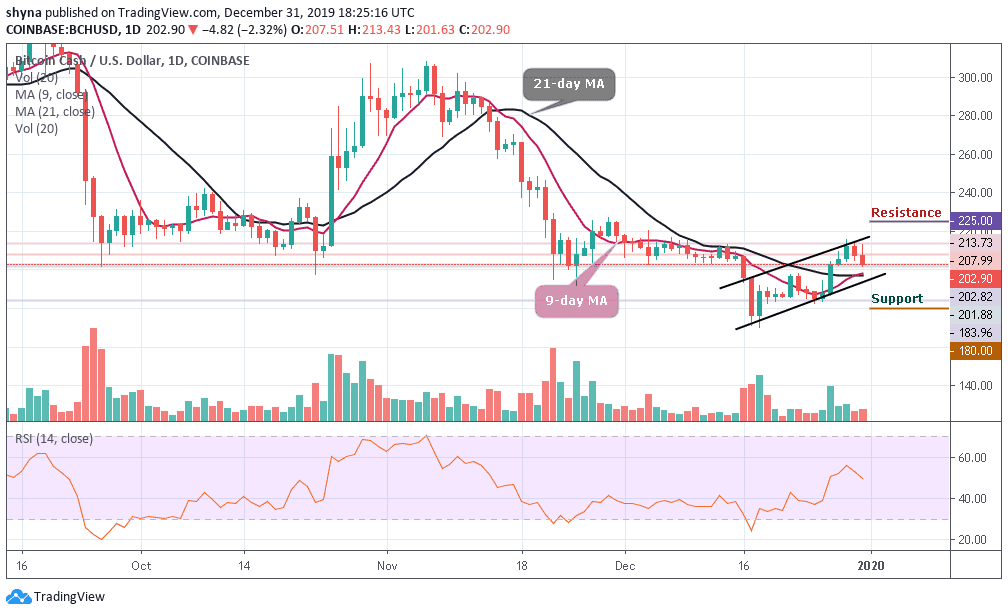
Yesterday, BCH/USD formed a support level at $207.99; currently heading below where it closed yesterday. Today, the coin is trading under selling pressure; gives no signs of recovery.
BCH/USD Market
Key Levels:
Resistance levels: $225, $235, $245
Support levels: $180, $170, $160
Since the beginning of this week, most of the major coins of the crypto market have been recording losses for quite some time now. Moreover, the BCH/USD price is crashing down even harder as it currently trades at $264.58. The price trend of BCH/USD is having more inversely trading red candles leading to loss-making investments.
Meanwhile, analyzing the daily movement of BCH/USD for the past 10 days, we see that the coin has started the month by trading at $217.88, after which it recorded two higher highs constantly. BCH/USD was unable to hold the volatility; the downtrend led the coin to trade at $171.21, recording a fall of over 15% from the monthly high price mark of $220.47.
However, BCH/USD is changing hands at $202.90 and trading above the 9-day and 21-day moving averages, if the market price drops further, the coin could slump to the support levels of $180, $170 and $160, bringing the price to a new monthly low. Meanwhile, a strong buying pressure may push the price to the resistance level of $215. While trading at $220, a bullish continuation is likely to touch the $225, $235 and $245 resistance levels.
The RSI (14) of the coin is at 49.28 level and could move in sideways before deciding on the next direction.
Today, the Bitcoin Cash has made an attempt to rise against Bitcoin but as it appeared, there’s a low amount of buying pressure in the market which is why the price dropped after it rose today. As the market opens today, the BCH/BTC broke the trend line of the ascending channel and touched the resistance level of the 2929 SAT.
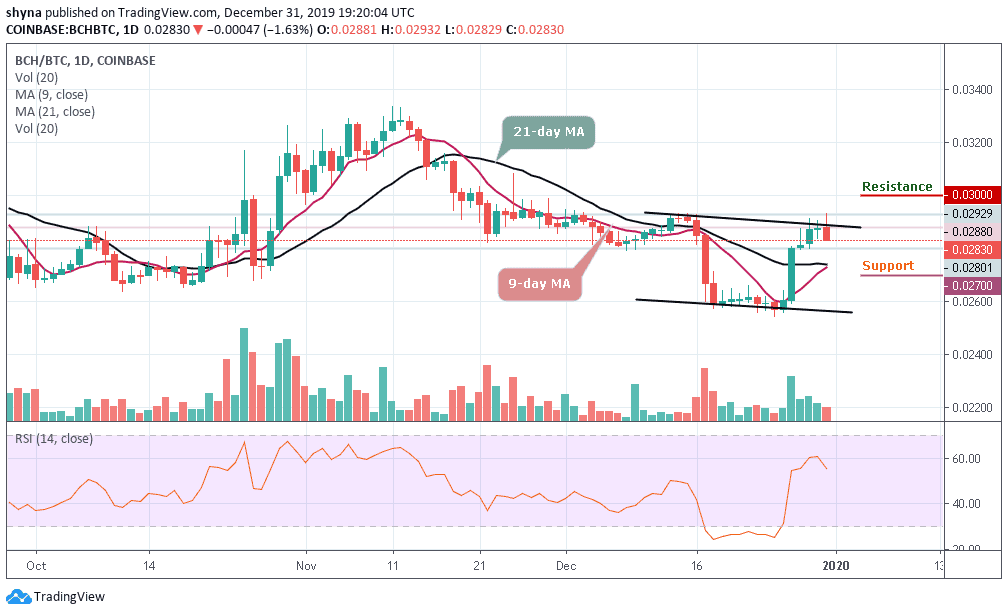
However, the bulls may be trying to stop the selling pressure but the resistance in this range is at 3000 SAT and above while the support is at 2830 SAT, a bearish continuation may touch 2700 SAT and 2600 SAT supports. Furthermore, a breach could slump the market to 2500 SAT support, creating a new low below the channel. The RSI (14) indicator after reaching 60-level made a quick turn to the south, which may likely give more bearish signals.
Please note: Insidebitcoins.com is not a financial advisor. Do your research before investing your funds in any financial asset or presented product or event. We are not responsible for your investing results.
Join Our Telegram channel to stay up to date on breaking news coverage