Join Our Telegram channel to stay up to date on breaking news coverage
BCH Price Prediction – August 5
Bitcoin Cash (BCH) has recovered from the intraday low $282.70 and recovered above $290 at the time of writing.
BCH/USD Market
Key Levels:
Resistance levels: $340, $350, $360
Support levels: $240, $230, $220
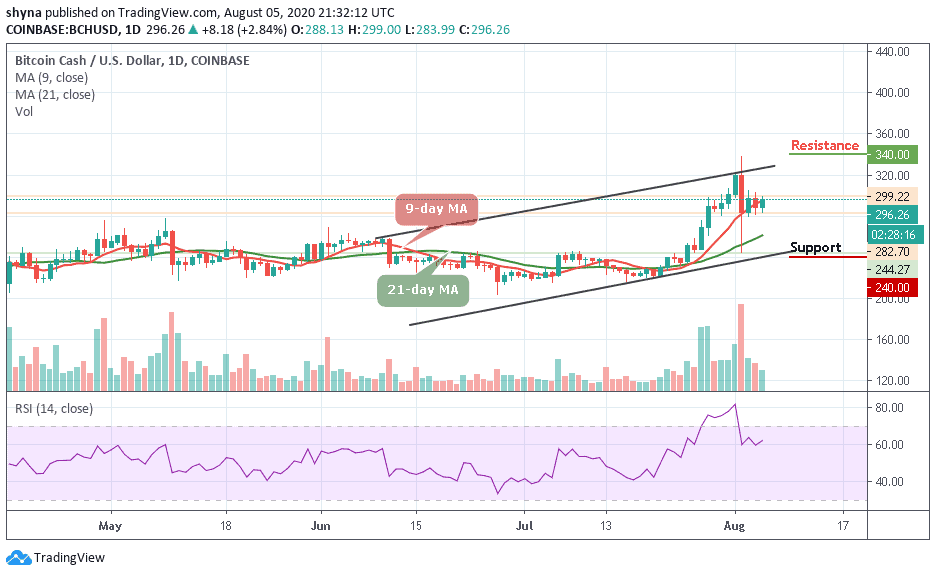
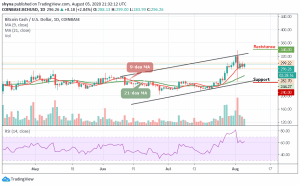
BCH/USD bulls are seen taking over the market at the time of writing. The market price has gone up from $282.70 to $299.22 as bulls look to re-enter the $300 resistance zone. Looking at the daily chart, BCH/USD bumped into a local resistance created by the 9-day moving average above $295. A sustainable move above this area may open up the way to the next barrier at $300. Once it is out of the way, the upside is likely to gain traction with the next focus on $320.
What is next for Bitcoin Cash price?
At the time of writing, BCH/USD is facing a critical resistance at $300 level above the 9-day and 21-day moving averages. A break above the ascending channel is likely to produce a huge green candle to the upside, marking resistances at $340, $350, and $360 levels. However, a bearish step back is likely to roll the market back to $290 support with a possible break down to $240, $230, and $220 supports, establishing a new low for the market.
Looking at the daily chart, the trading volume is rising gradually, giving a sign of an upcoming big move. The RSI (14) hovers above the 60-level due to the increase in price. A precise bear cross below this level might reveal a sell signal for the market.
With Bitcoin comparisons, the market has evolved for a while in a very different way. However, the downtrend is seen giving the sellers more confidence to increase their entries. More so, if the bears succeeded in the broken price, one would expect the market to fall to the support level of 2400 SAT and 2350 SAT.
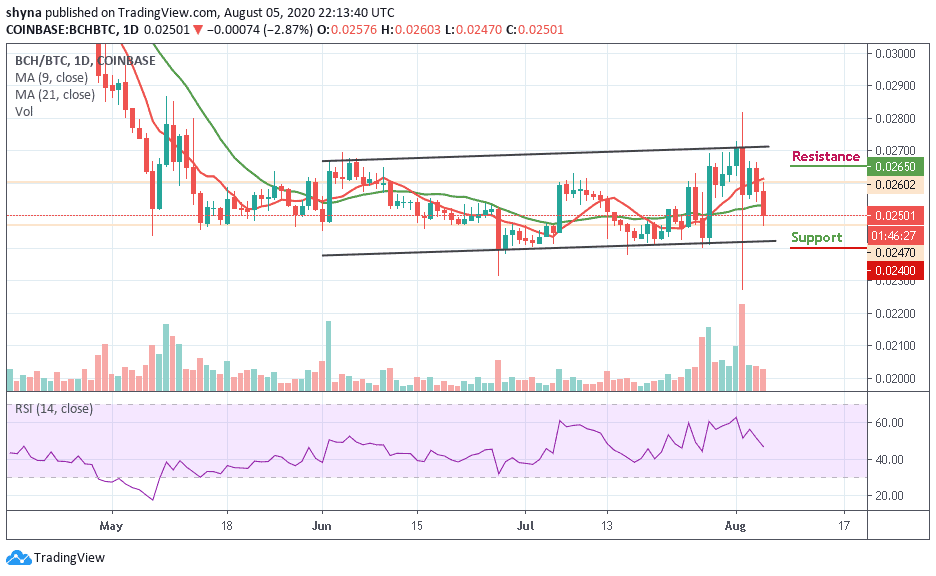
Meanwhile, a rebound could increase it to the 2650 SAT and 2700 SAT BTC resistance level. The technical indicator RSI (14) is seen following the downtrend as the signal line moves below 50-level, suggesting more bearish signals.
Join Our Telegram channel to stay up to date on breaking news coverage