Join Our Telegram channel to stay up to date on breaking news coverage
BCH Price Analysis – June 30
The price of Bitcoin Cash is back to the drawing board as the coin seeks support at $220.
BCH/USD Market
Key Levels:
Resistance levels: $240, $260, $280
Support levels: $200, $180, $160
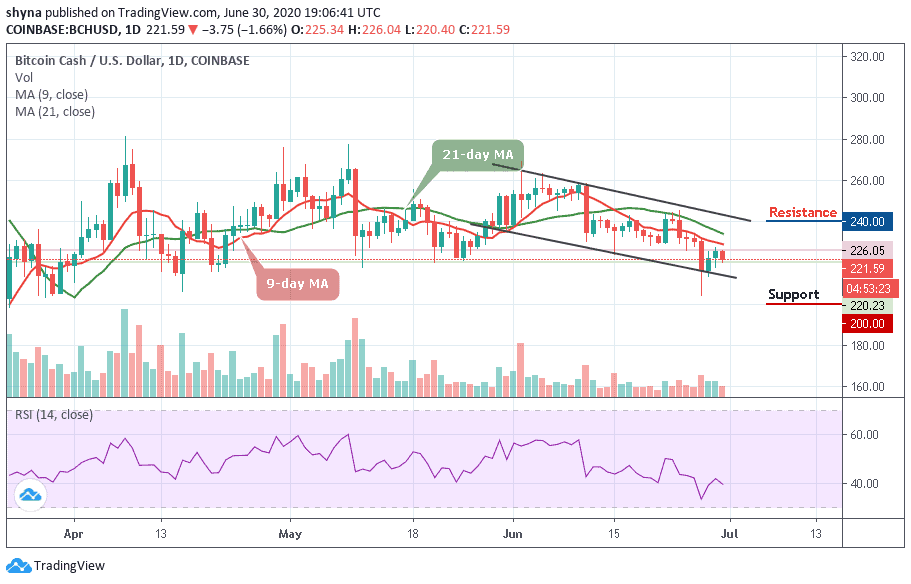
BCH/USD is currently battling with the bearish pressure that continues to dominate the entire crypto landscape. A few actions were witnessed to the upside over the past few days. However, the zone between $215 and $225 remained intact as the key support level. The bulls are keen to ensure that the price stays above the 9-day and 21-day moving averages.
However, the BCH price continues to consolidate itself in a flag formation, waiting for a cross below the lower boundary of the channel. Similarly, the daily breakdown reveals that Bitcoin Cash is dropping towards the support level of $220 after the opening of the market today where it corrected itself to where it is trading currently at $221.59 level. If the support gets weak, more price break-down may occur as the bears may find new weekly lows at $200, $180, and $160 support levels.
Nevertheless, a bullish movement across the moving averages may roll back the market to $235 resistance with a possible break out of the channel and could move to reach the potential resistance levels at $240, $260, and $280, establishing a new weekly high for the market. At the moment, the technical indicator RSI (14) may cross below the 40-level to confirm the bearish movement.
Comparing with Bitcoin, the recent sideways movement is due to price stability. At the moment, the market is preparing to change the trend and a short-term bearish breakout is most likely to play out because the technical indicator RSI (14) moves below 40-level and this could find the nearest support levels at 0.022 BTC and below.
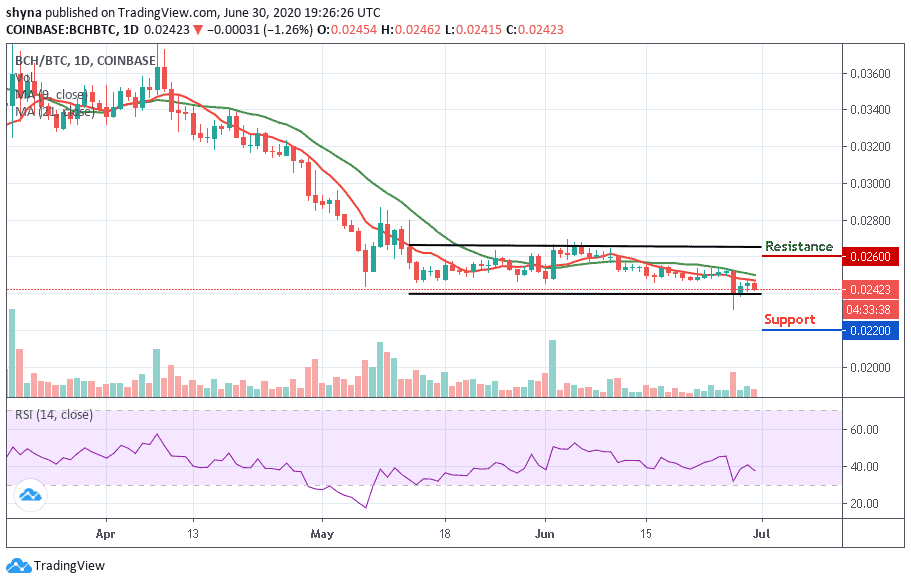
However, the only condition for the resumption of the bullish trend is if the 0.024 BTC level continues to provide support for the market, then the price may be pushed to the resistance level of 0.026 BTC and above. Meanwhile, the BCH/BTC pair continues to remain in sideways movement hovering below the moving averages.
Join Our Telegram channel to stay up to date on breaking news coverage