Join Our Telegram channel to stay up to date on breaking news coverage
Bitcoin (BTC) Price Prediction – June 30
BTC/USD resumes the decline after consolidation in a narrow channel but the buying interest may increase on approach to $9,500.
BTC/USD Long-term Trend: Bearish (Daily Chart)
Key levels:
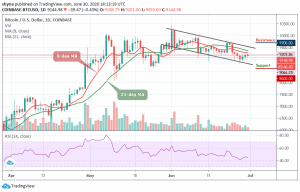
Resistance Levels: $9,700, $9,900, $11,100
Support Levels: $8,600, $8,400, $8,200

At the early hours of today, after touching $9,205.86, BTC/USD is seen retreating towards the support of $9,000 at the time of writing. The Bitcoin price has been recovering slowly after a volatile start of the week. Meanwhile, the psychological barrier of $9,500 still serves as the first important resistance within the market. More so, a sustainable move above this level may likely push the price towards the weekly high at $9,300.
Meanwhile, on the daily chart, BTC/USD keeps moving below the 9-day and 21-day moving averages, which increases the selling pressure. More so, if this continues, the sell-off may be extended below the lower boundary of the descending channel. In addition, the dips to $8,800 are likely to be bought, which means the overall bullish sentiments may prevail.
Moreover, if the price moves below the mentioned-support, $8,700 could come into focus which served as a support during the previous consolidation period while the critical supports lie at $8,600, $8,400, and $8,200. On the upside, the first resistance may come at $9,400. Once it is clear, $9,500 may come back into focus. Further bullish movement may hit the potential resistance levels at $9,700, $9,700, and $10,100 as the technical indicator RSI (14) moves below 45-level.
BTC/USD Medium-Term Trend: Bearish (4H Chart)
BTC/USD on 4-hour chat is currently in the ascending range of the medium-term outlook. On the flip side, if $9,500 remains unconquered in the short term, bullish influence could spike. In this case, the accrued gains could be trimmed massively.

The technical indicator RSI (14) is retreating even though it had not reached the 45-level. As long as the downward trend continues, keeping Bitcoin above $9,500 will be a daunting task. In this case, it is best we look at possible support levels, starting at $8,900, $8,700, and $8,500. While the resistance lies at $9,400 and above.
Join Our Telegram channel to stay up to date on breaking news coverage