Join Our Telegram channel to stay up to date on breaking news coverage
BCH Price Analysis – January 25
Bitcoin Cash price is trading in the red, with losses of 1.49% in the market and making way for further pressure south.
BCH/USD Market
Key Levels:
Resistance levels: $360, $370, $380
Support levels: $270, $260, $250
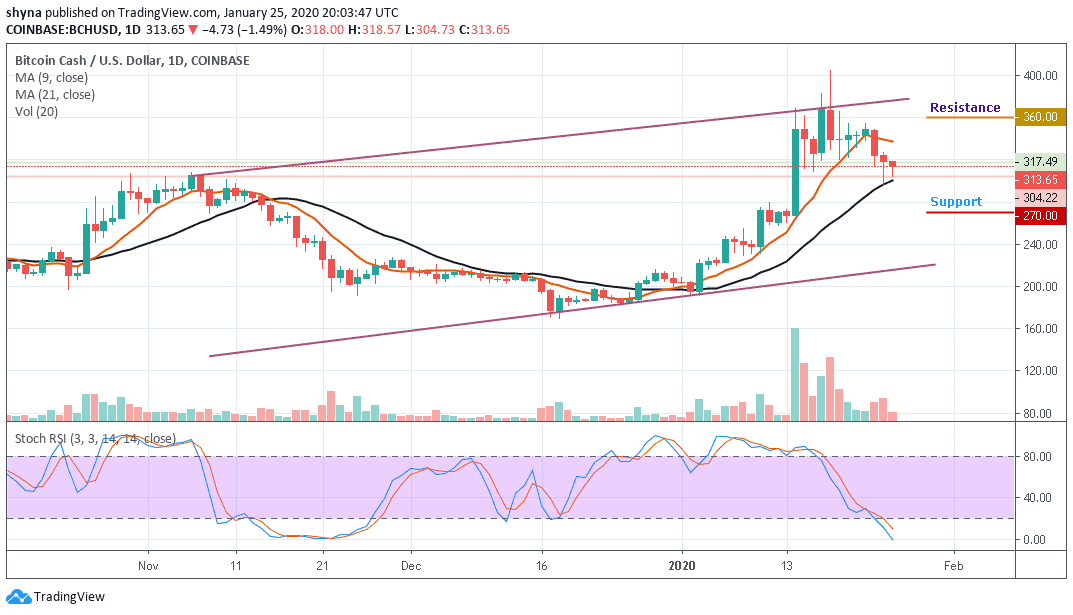
Looking at the daily chart, BCH/USD could no longer defend the support level of $318 again as the price hovers around $313. The coin is now moving below the 9-day moving average indicating a bearish trend. For the time being, the market price is currently moving towards the 21-day moving average within the channel while the technical indicator stochastic RSI has entered into the oversold zone issuing some bearish signals.
However, taking a look at the market, the daily chart reveals that Bitcoin Cash is yet to show a strong bear dominance in the long-term. But the short-term outlook looks bearishly strong. However, a bullish interception may set the next key resistance at $360, $370, and $380, crossing both the 9-day and 21-day moving averages.
In other words, if the bulls fail to stop the selling pressure; the price may likely fall to the support level of $290 and while trading at this level, a breach could slump the market to another supports of $270, $260 and $250 levels, creating a new low below the moving averages.
BCH/BTC Market
Against Bitcoin, BCH performance has been very low due to a recurring bearish sentiment which has caused the market to fall drastically. As the price falls, sellers are posing an additional threat for buyers to reach the 0.036BTC support level where the nearest target is located. In addition, any eventual break below the lower side of the descending channel may cause Bitcoin Cash to collapse.
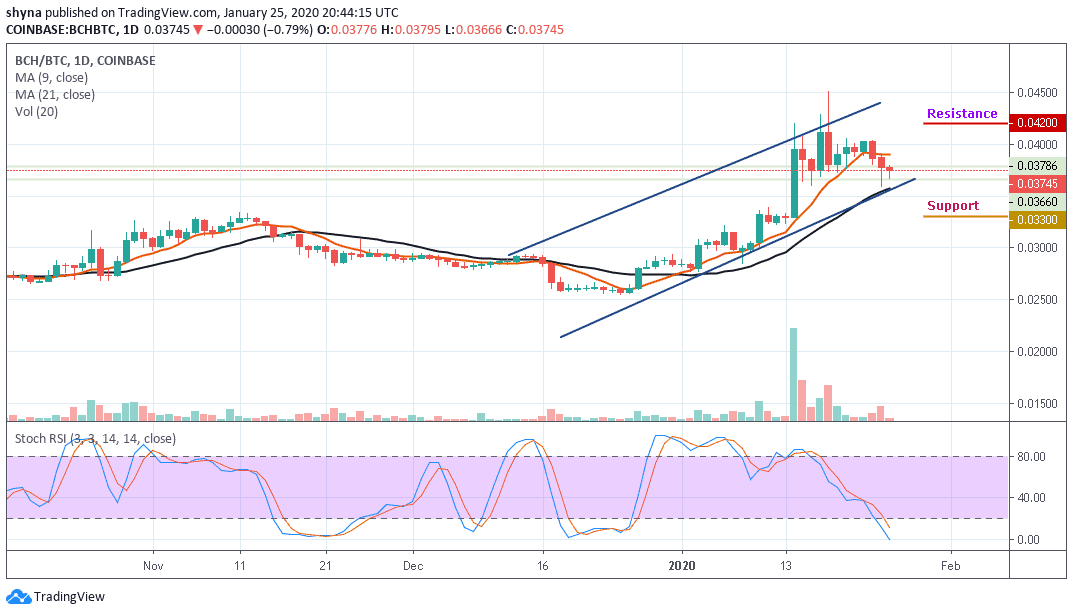
Meanwhile, for a positive upsurge, the 0.042BTC and 0.044BTC are the major resistance levels for the coin for now. Therefore, a bearish continuation could retest the important support at the 0.035BTC and 0.034BTC before a possible slip to 0.033BTC and below. The trading volume is fading away while the stochastic RSI is at the oversold zone, waiting for buying pressure when the indicator faces up.
Please note: Insidebitcoins.com is not a financial advisor. Do your research before investing your funds in any financial asset or presented product or event. We are not responsible for your investing results.
Join Our Telegram channel to stay up to date on breaking news coverage